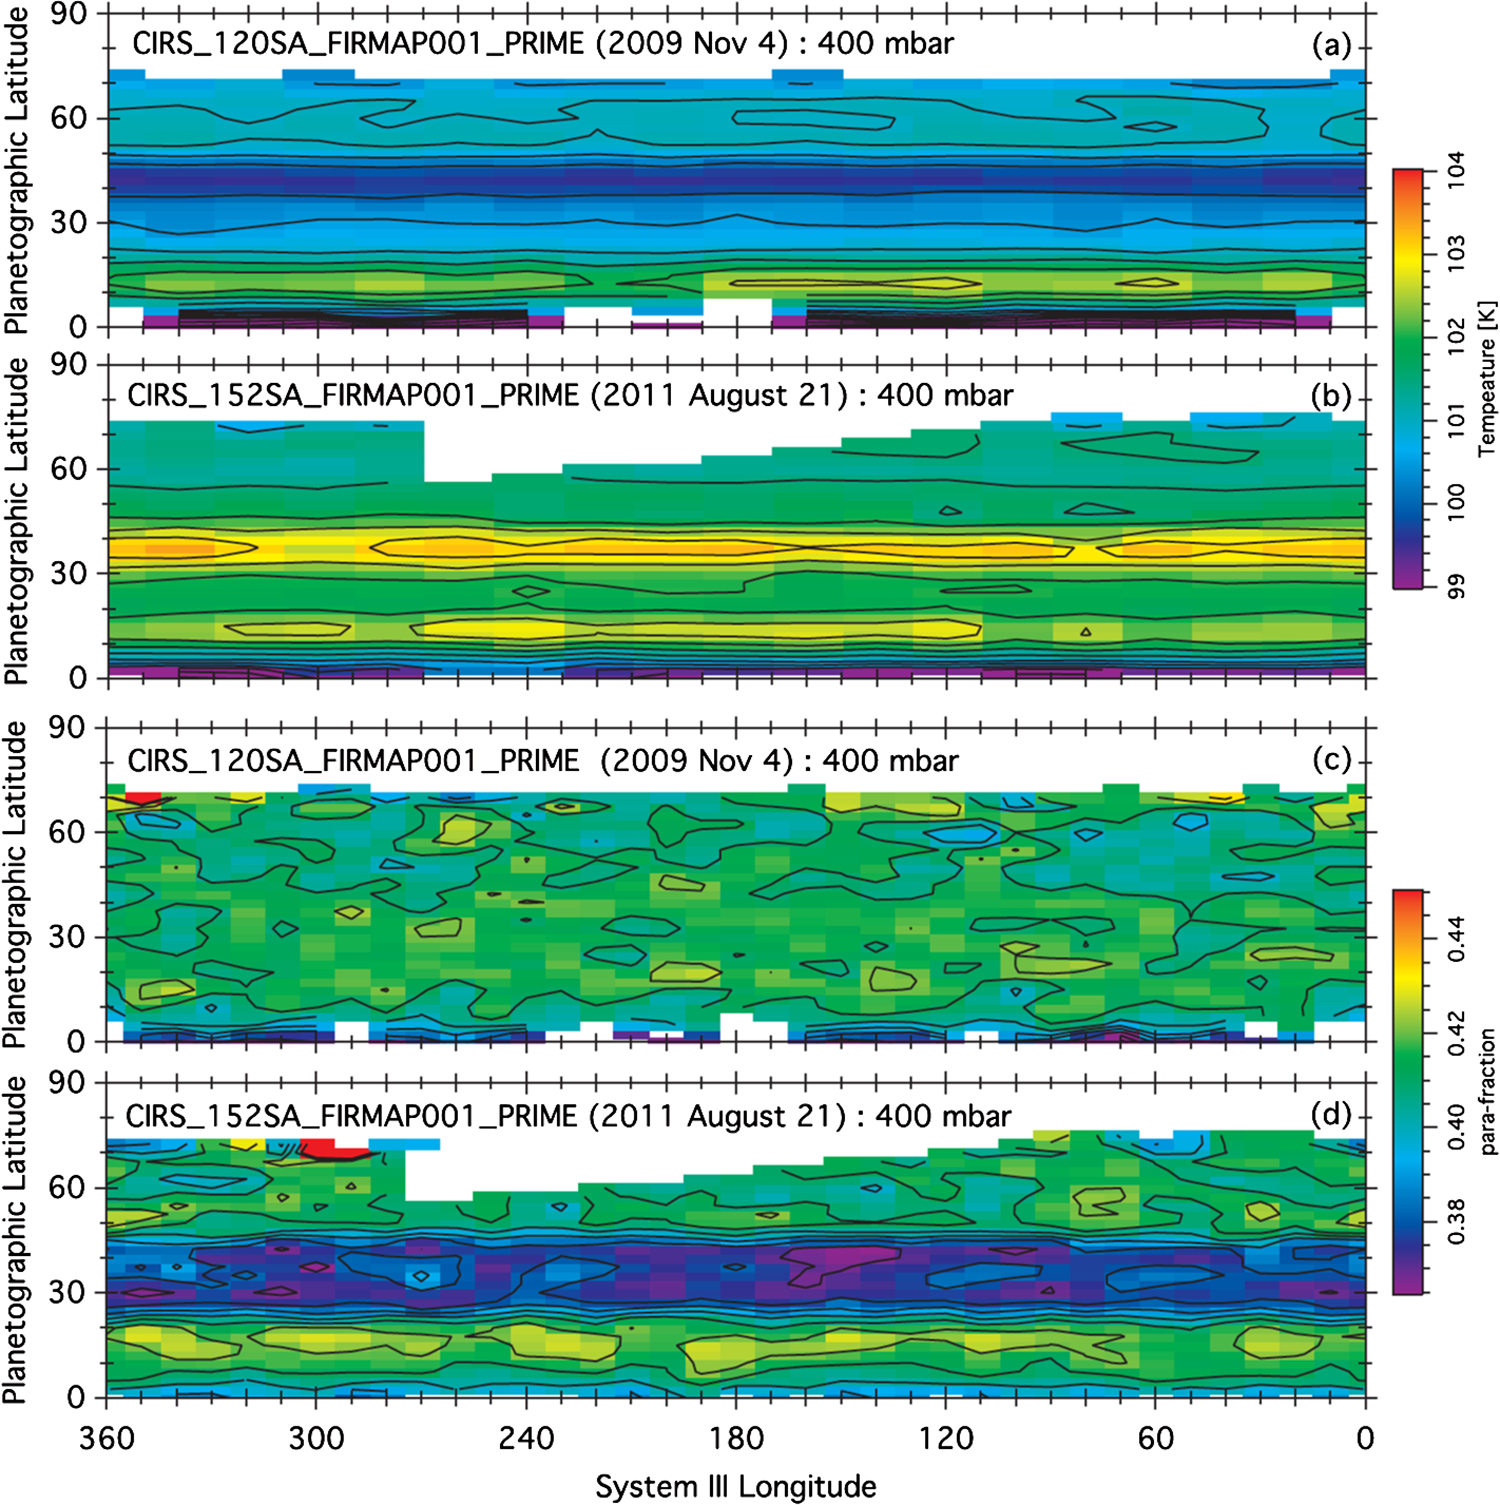
Fig. 11.

Cassini CIRS cylindrical projections showing evidence of air being dredged up from below. The top two panels show tropospheric temperature before and after the storm and the band from 30–40° planetographic has warmed by several degrees. The bottom two panels show the two chemical states (nuclear spins parallel and nuclear spins anti-parallel) of molecular hydrogen H2 before and after the great storm. The 30–40° band shows a low para fraction, which indicates that the air has risen from below cloud base (Achterberg et al. 2014)
