Fig. 19.

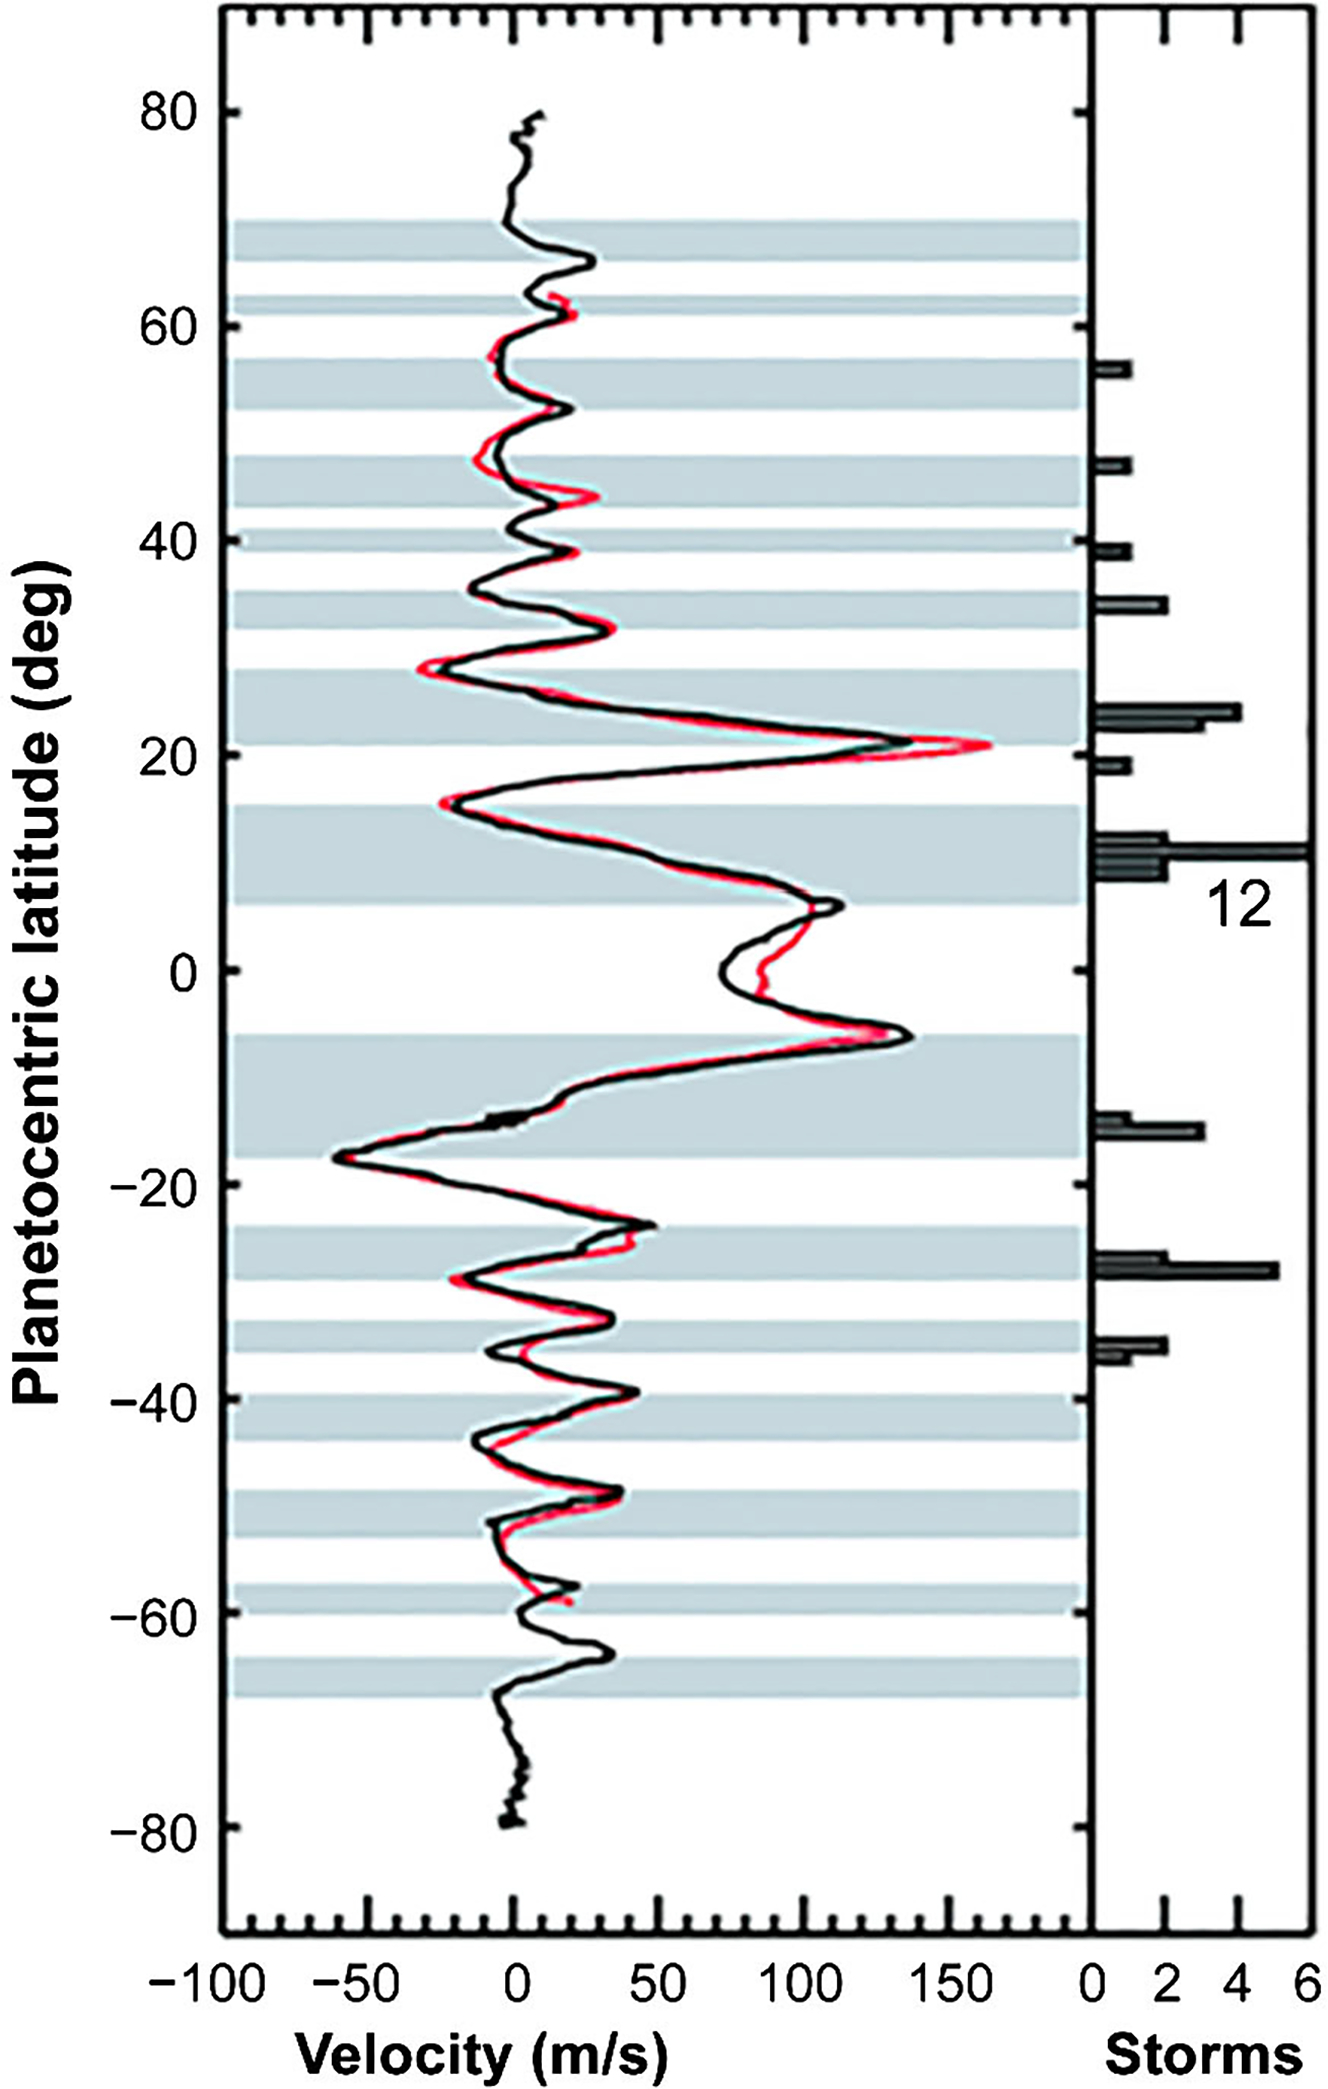
Atmospheric zonal velocity for Jupiter. The black curve is from Cassini ISS data in late 2000, and the red curve is from Voyager data in mid-1979. The jets are remarkably steady over this 21-year interval (Porco et al. 2003)

Atmospheric zonal velocity for Jupiter. The black curve is from Cassini ISS data in late 2000, and the red curve is from Voyager data in mid-1979. The jets are remarkably steady over this 21-year interval (Porco et al. 2003)