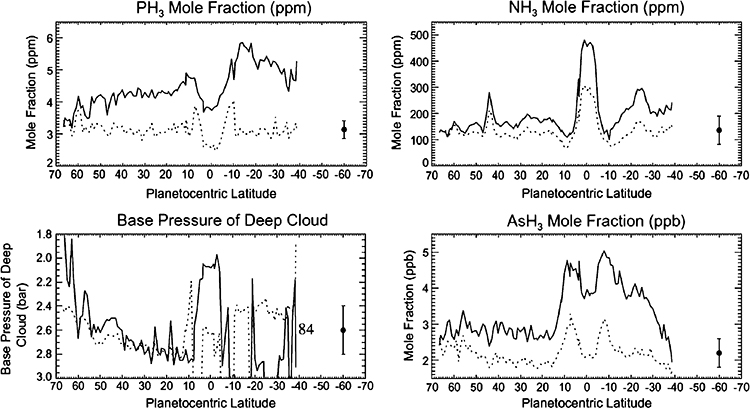
Fig. 2.
Tropospheric chemical abundances from Cassini VIMS. On first look, the profiles do not tell a consistent story. NH3 shows a high mole fraction at the equator, consistent with upwelling there and downwelling on either side at 10–12° latitude, but PH3 and AsH3 show low abundances at the equator, consistent with downwelling. The data may be indicating a double Hadley cell, with rising motion at the higher altitudes at the equator and sinking motion deeper down (Fletcher et al. 2011a)

