
Fig. 3.
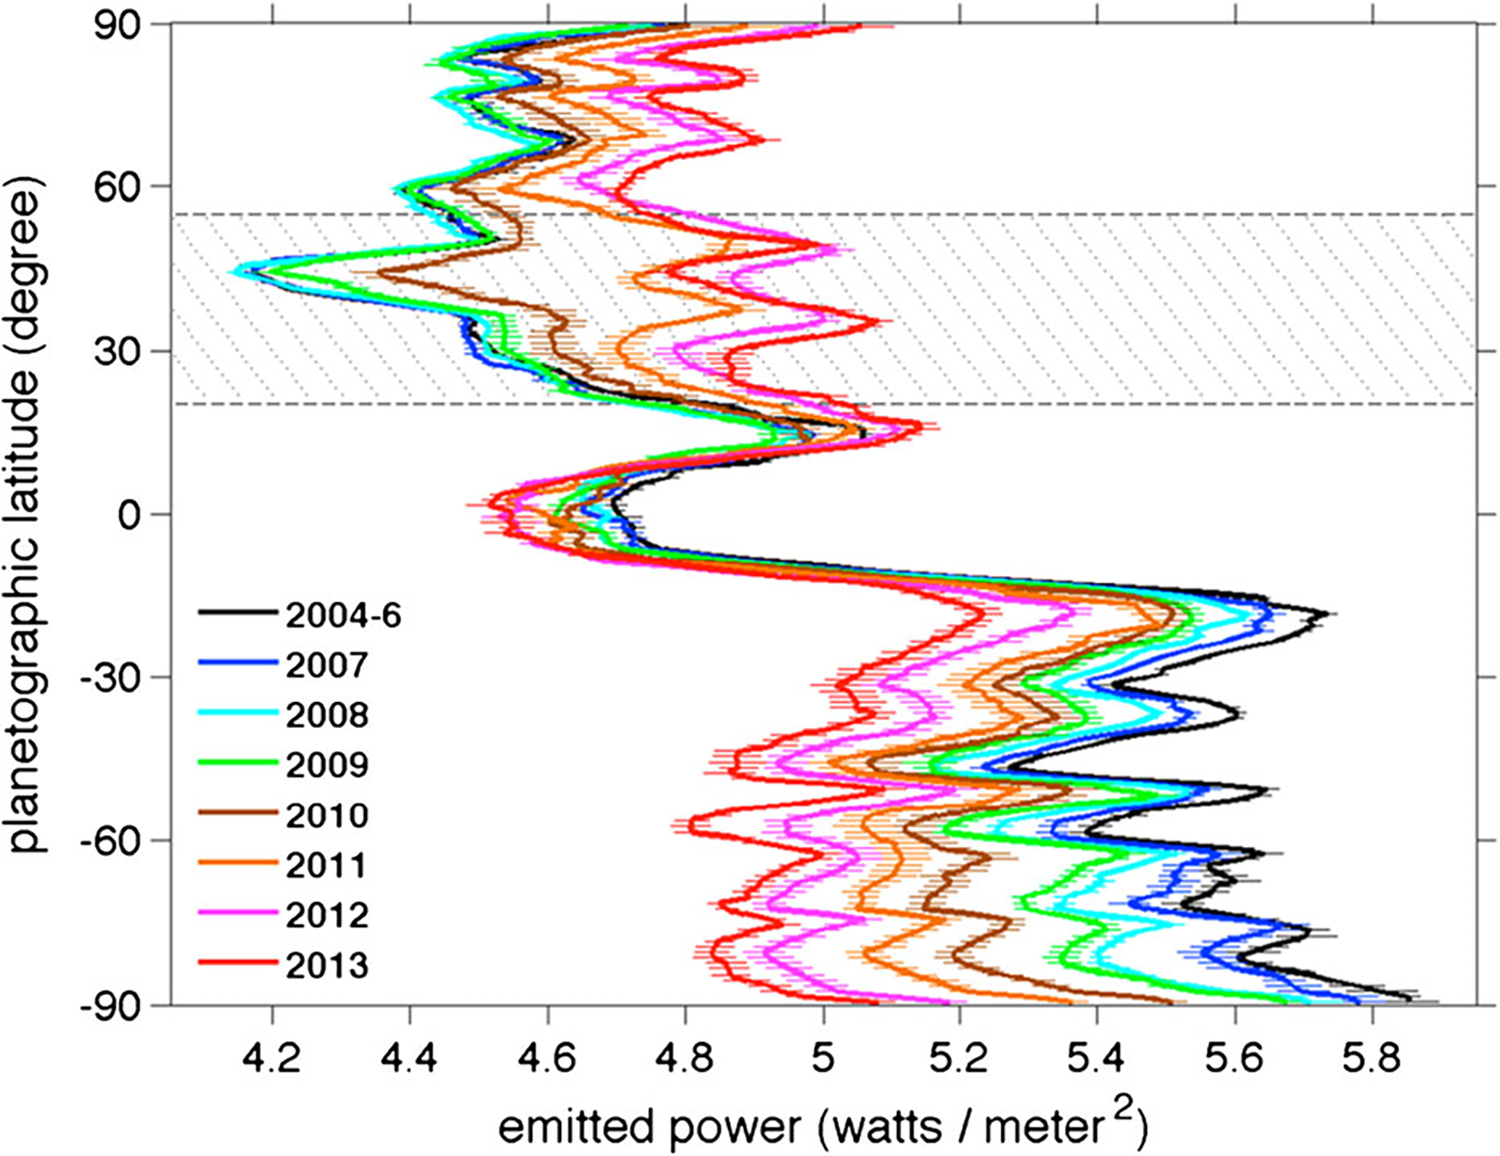
Thermal emission of the planet in units of W m−2 from Cassini CIRS. In the south the season was early summer in 2004 and mid fall in 2013. The decrease in thermal emission in the south was due to cooling of the atmosphere. Comparing the years before and after 2011, it is clear that the great storm increased the thermal emission by 5–10% in the 30–40° latitude band, and that the anomaly persisted for several years (Li et al. 2015)