
Figure 4.
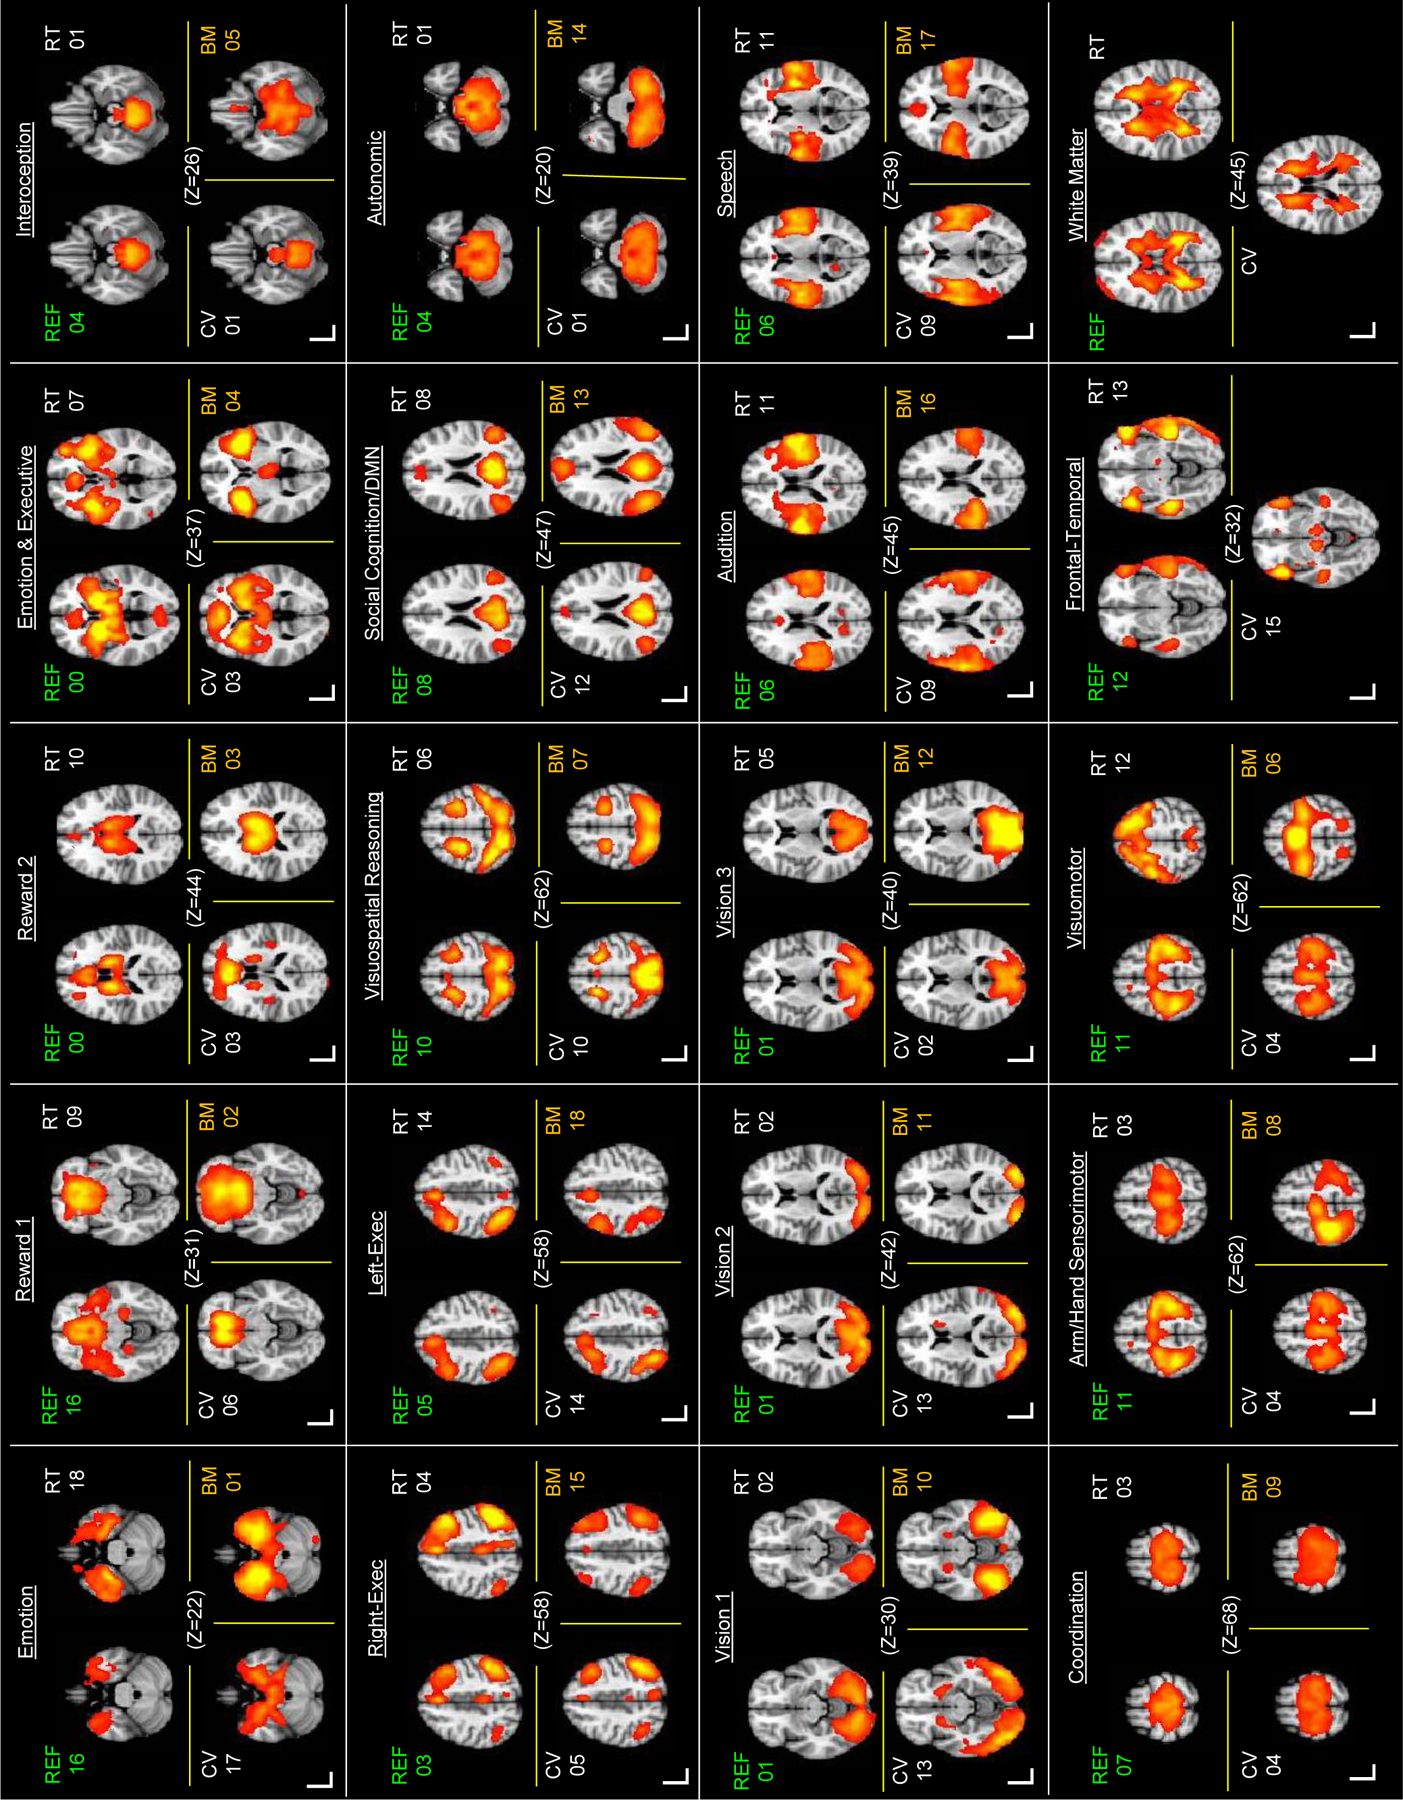
Axial slices of ICNs derived from Reference Sample (REF), Retest Sample (RT), Cross-validation Sample (CV) separately, and the matched BrainMap Task-based network derived from contrast images (BM; Laird et al. 2011). Connectivity intensity was thresholded at Z ≥ 6. Note, some ICNs were associated with multiple BrainMap components; accordingly they appear in multiple instances in the figure. Two components were present in the three independent samples which were not present in the BrainMap data (see lower right corner): one was a bilateral frontal-temporal ICN (REF 12) which weakly loaded on social cognition, executive, and audition BrainMap networks; the other was a white matter component and as such was not included in the subsequent analyses.