
Figure 5.
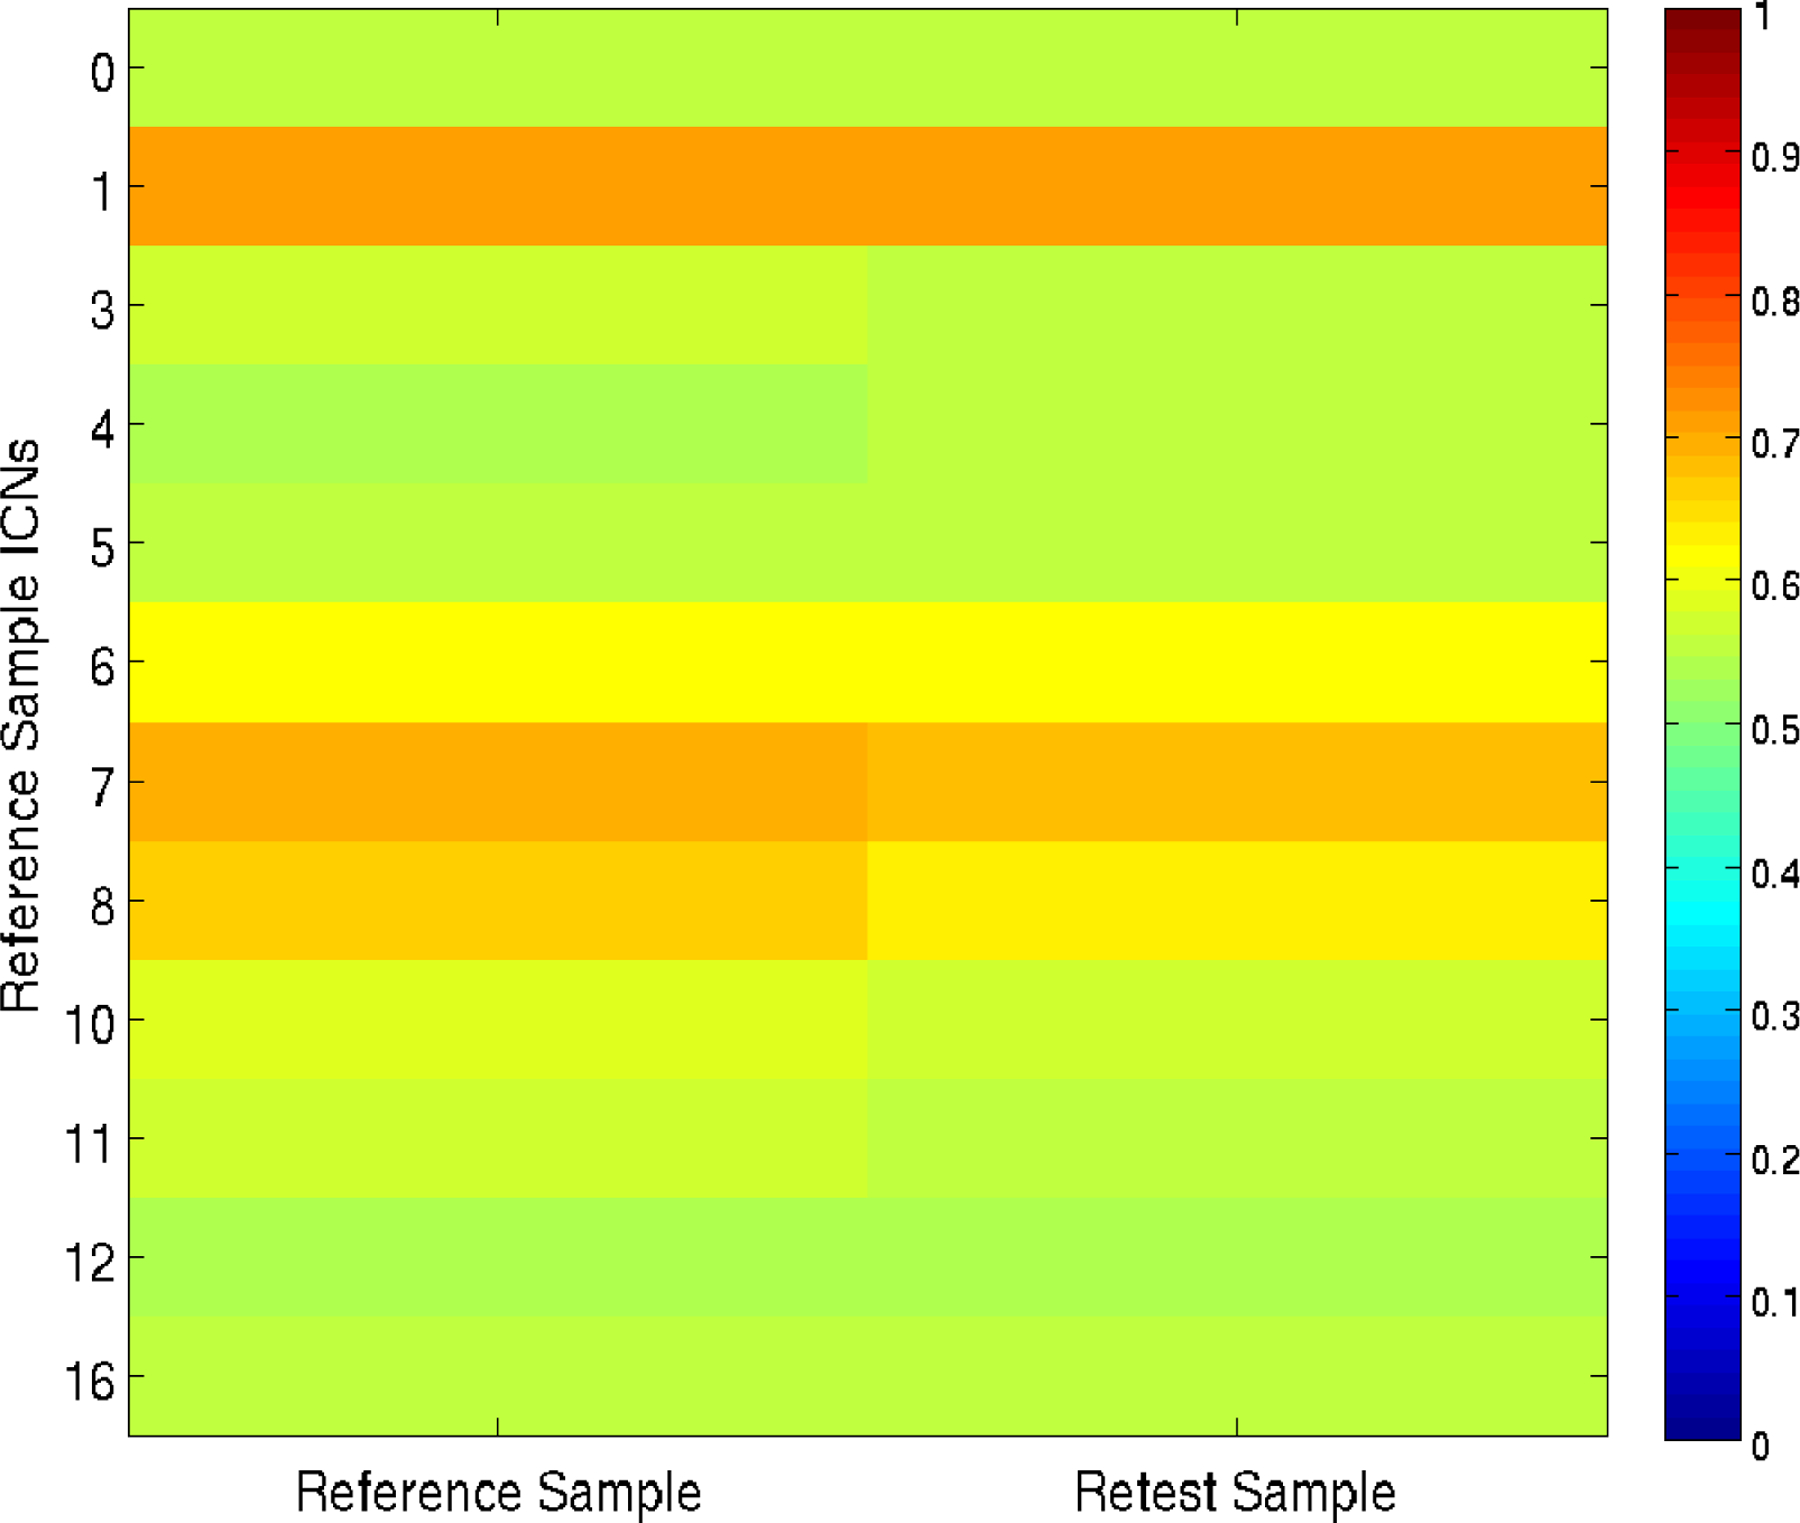
Heat map matrix illustrating the internal consistency of the Reference Sample ICNs. Item-total correlations were computed for each ICN for both samples separately by applying ICN masks from the Reference Sample to the preprocessed data from the Reference and Retest Sample. Mean item-total correlations across voxels within the mask was calculated for each ICN for each subject; the mean across subjects was then calculated to summarize the findings at the separate time points. See Figure 3 or 4 for the Reference Sample (REF) ICN identifiers.