
Figure 6.
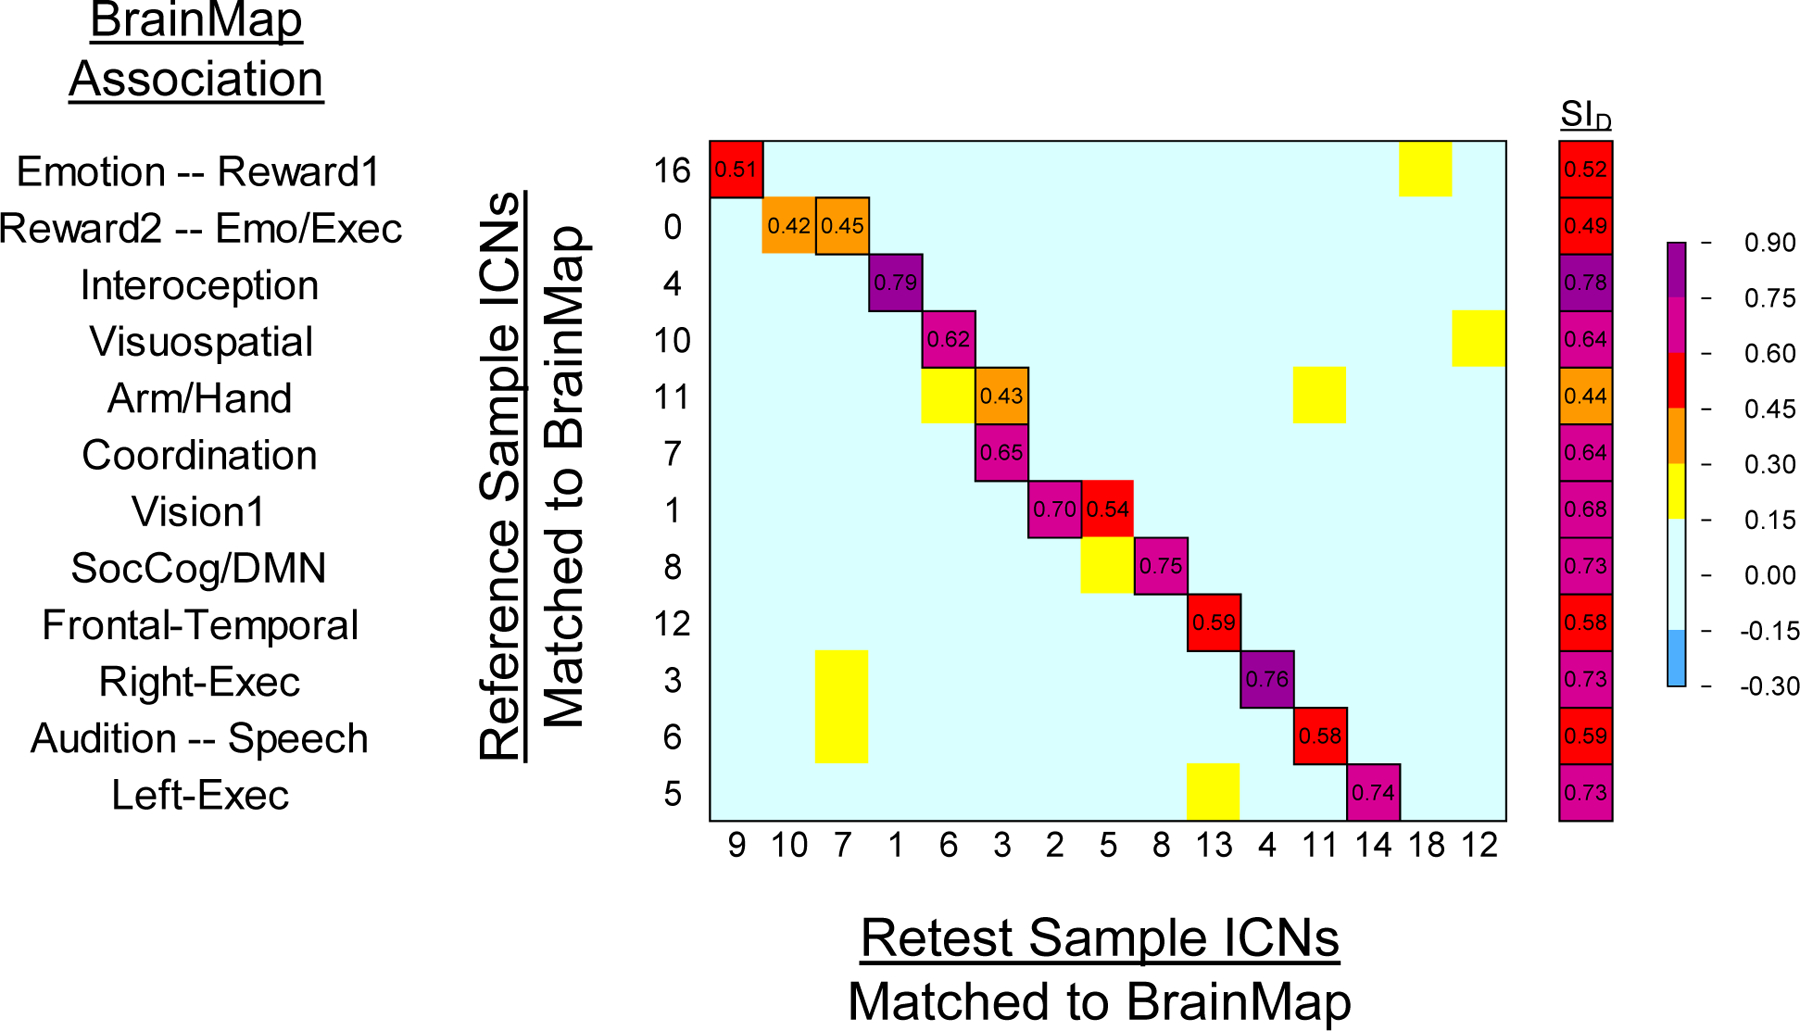
Heat map matrices correlating Reference Sample ICNs with Retest Sample ICNs to indicate reliability using Spearman’s correlations across brain voxels for each ICN. To the right is the Dice Similarity Index for matched volumes from the two samples; outlined cells indicate paired ICNs used in the Dice Similarity Index. BrainMap domain labels on the y-axis were determined by the associations revealed by Reference Sample and BrainMap network correlations.