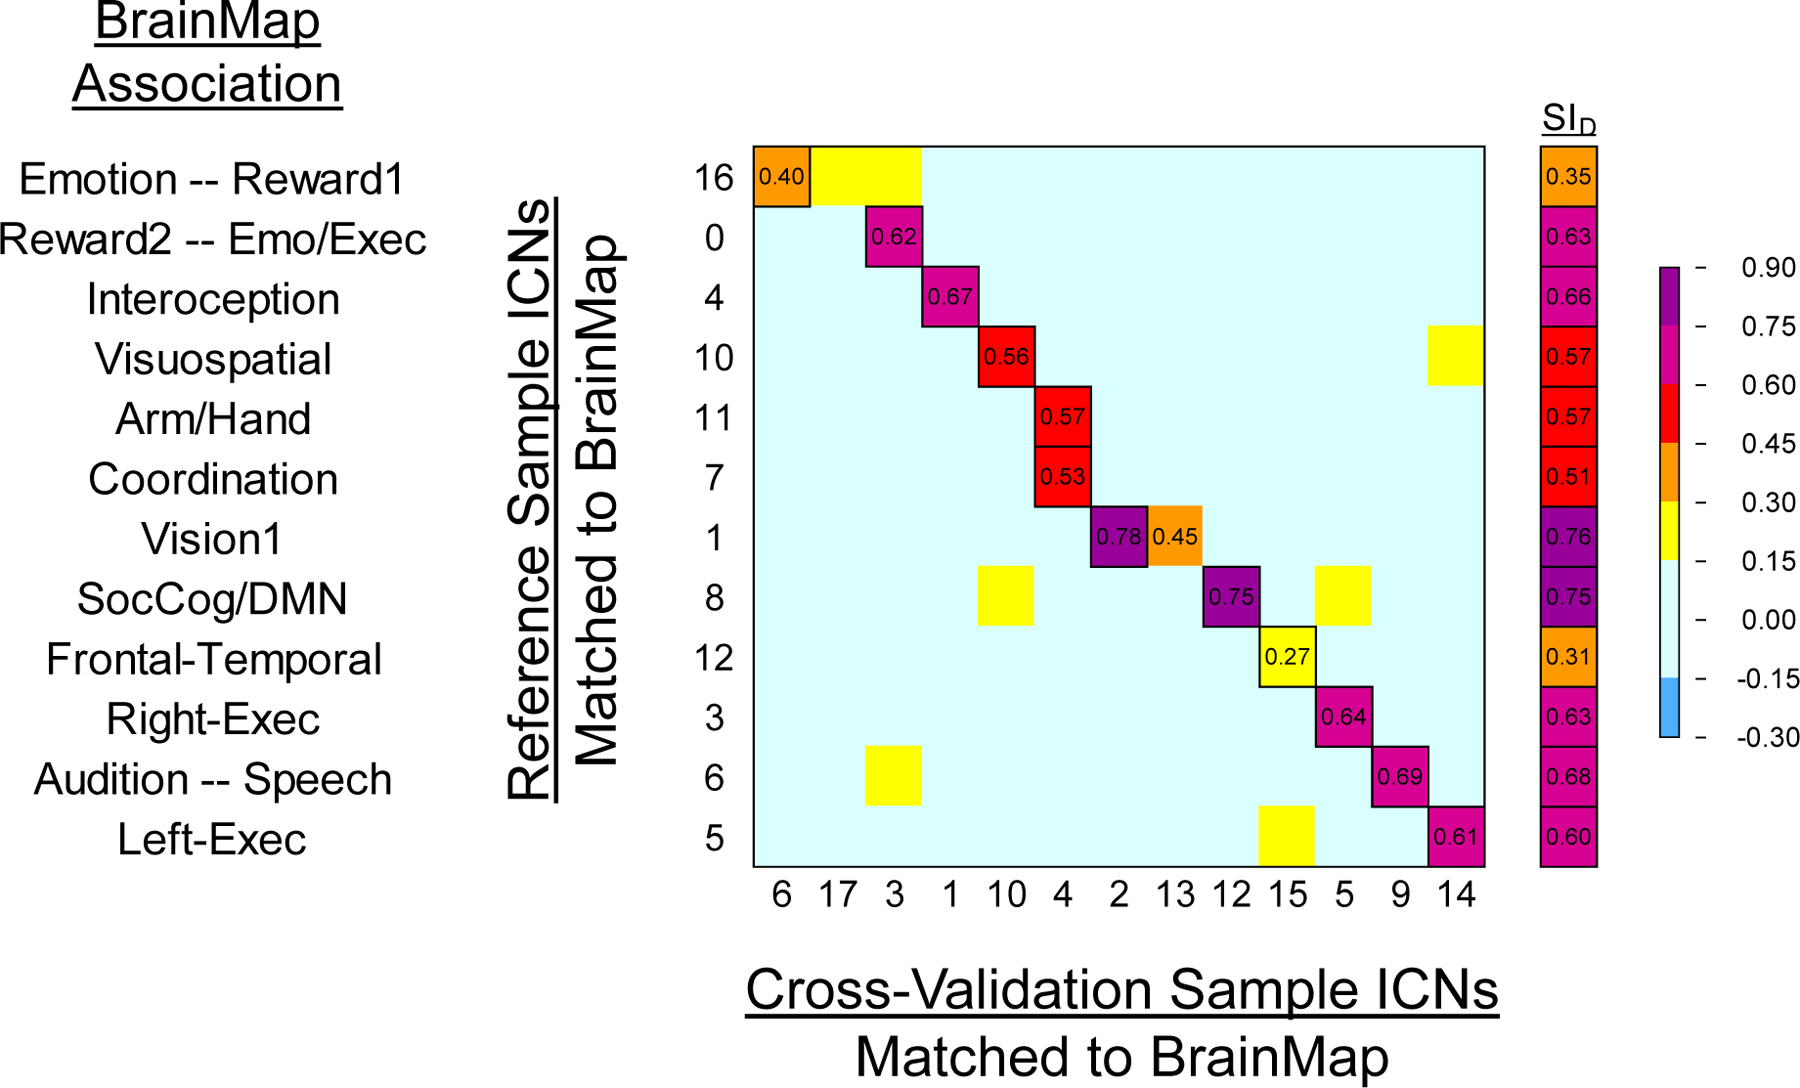
Figure 8.

Heat map matrices correlating Reference Sample ICNs with Cross-Validation Sample ICNs to indicate reproducibility using Spearman’s correlations across brain voxels for each ICN. To the right is the Dice Similarity Index for matched volumes from the two samples; outlined cells indicate paired ICNs used in the Dice Similarity Index. BrainMap domain labels on the y-axis were determined by the associations revealed by Reference Sample and BrainMap network correlations.
