
Figure 9.
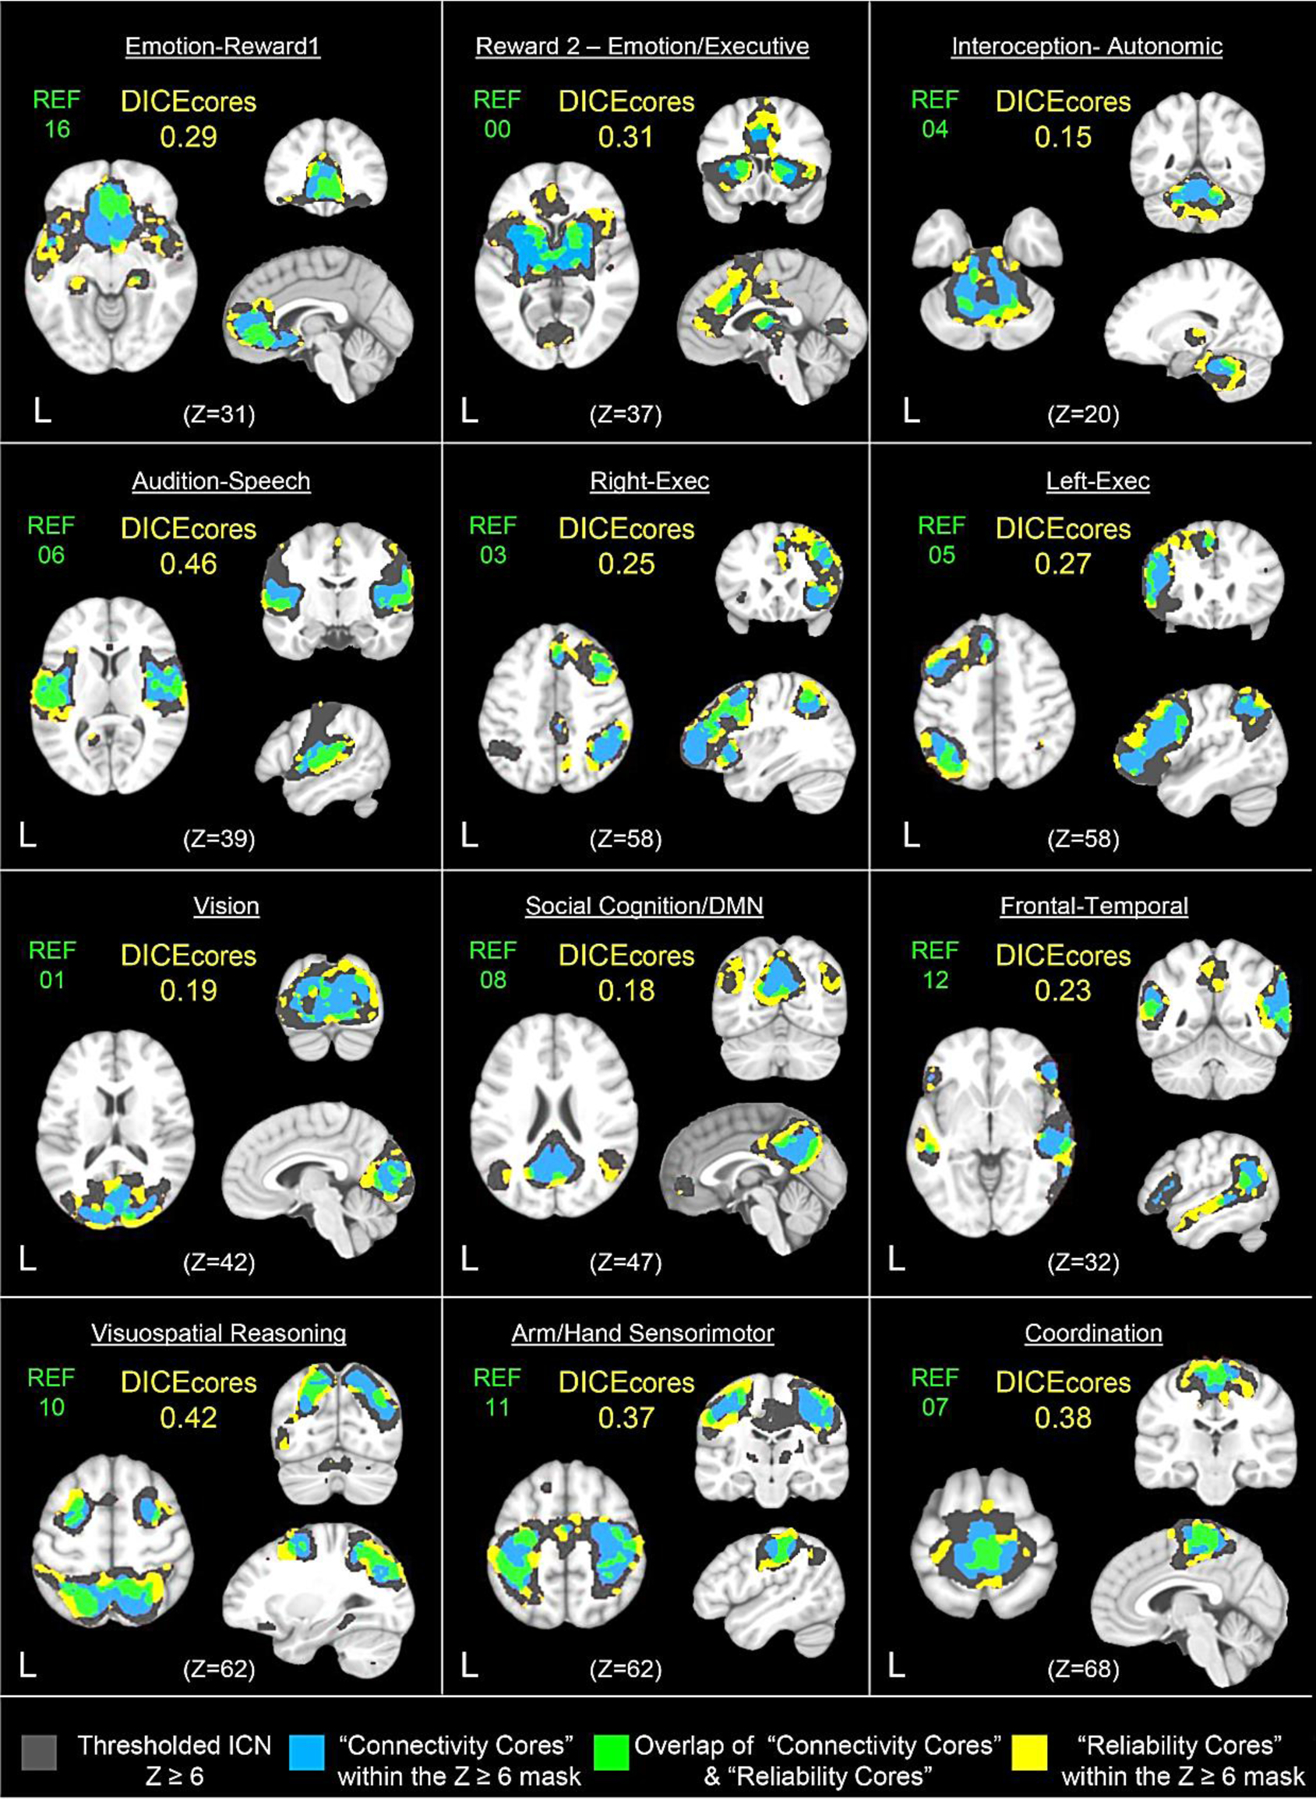
Comparison of brain maps including voxels of varying degrees of reliable resting-state connectivity for the Reference Sample meta-ICNs. Also shown is the extent of spatial overlap of the varying degrees of reliability maps, accompanied by the Dice Similarity Index which quantifies the degree of overlap between the connectivity cores and reliability cores, thus indicating the degree of shared voxels. Dark gray indicates the meta-ICN with connectivity thresholded at z ≥ 6; blue indicates the “connectivity cores” that are regions where connectivity values include only those above the 75th percentile within the z ≥ 6 mask; yellow indicates the “reliability cores” that are regions where the intraclass correlation coefficient are above the 75th percentile within the z ≥ 6 mask; green indicates the overlap or intersection of the connectivity cores with the reliability cores.