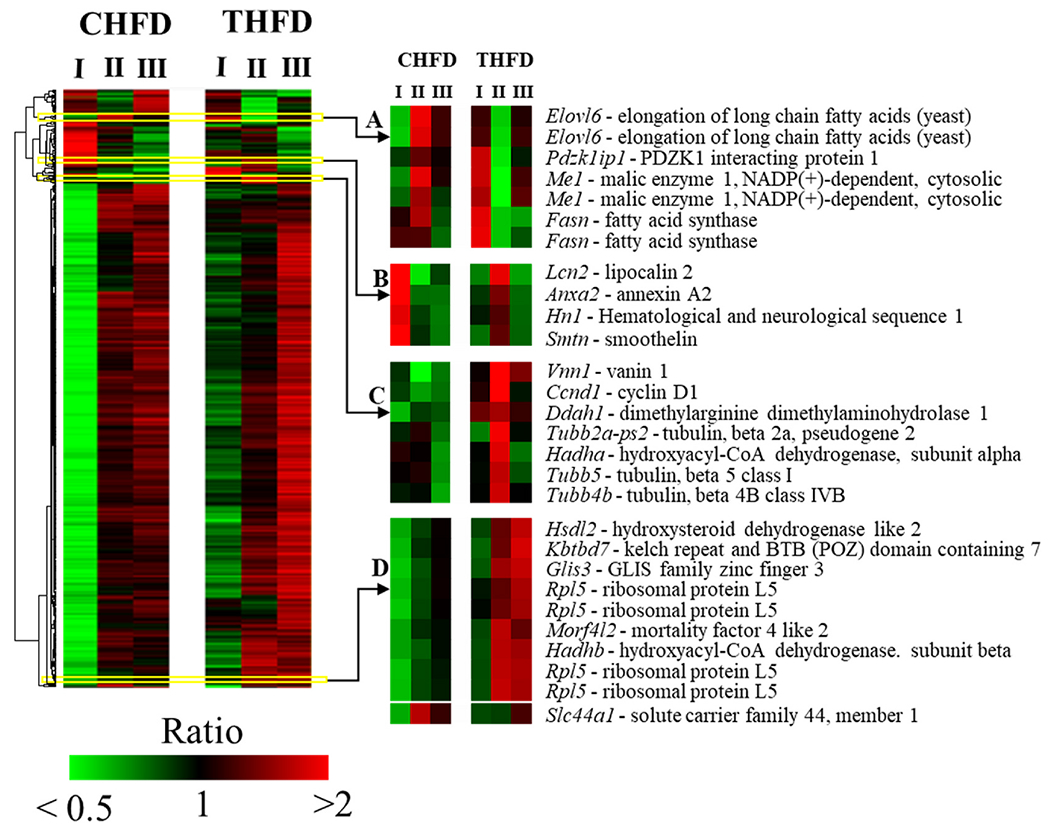
Fig. 2. Liver genes are modulated by Tempol.

Heat map of 598 features altered by 2.5-fold at one-way ANOVA p < 0.01. Mean centered logarithmic expression ratios are shown in the heat map. Features were clustered by average linkage algorithm using 1-correlation as distance metric. CHFD – control high fat diet. THFD – Tempol + high fat diet. I, II, and III are the time points from Fig. 1A. I – day 70 when the CHFD and THFD fed animal weights were 45g and 25g respectively; II – day 85 when animals reached equal weights by switching CHFD and THFD; III – day 120, continuation of the respective diets until animal weights on CHFD increased to 45g.
