
Fig. 7. Relationship between gut microbiome population in CD, CHFD and THFD mice.
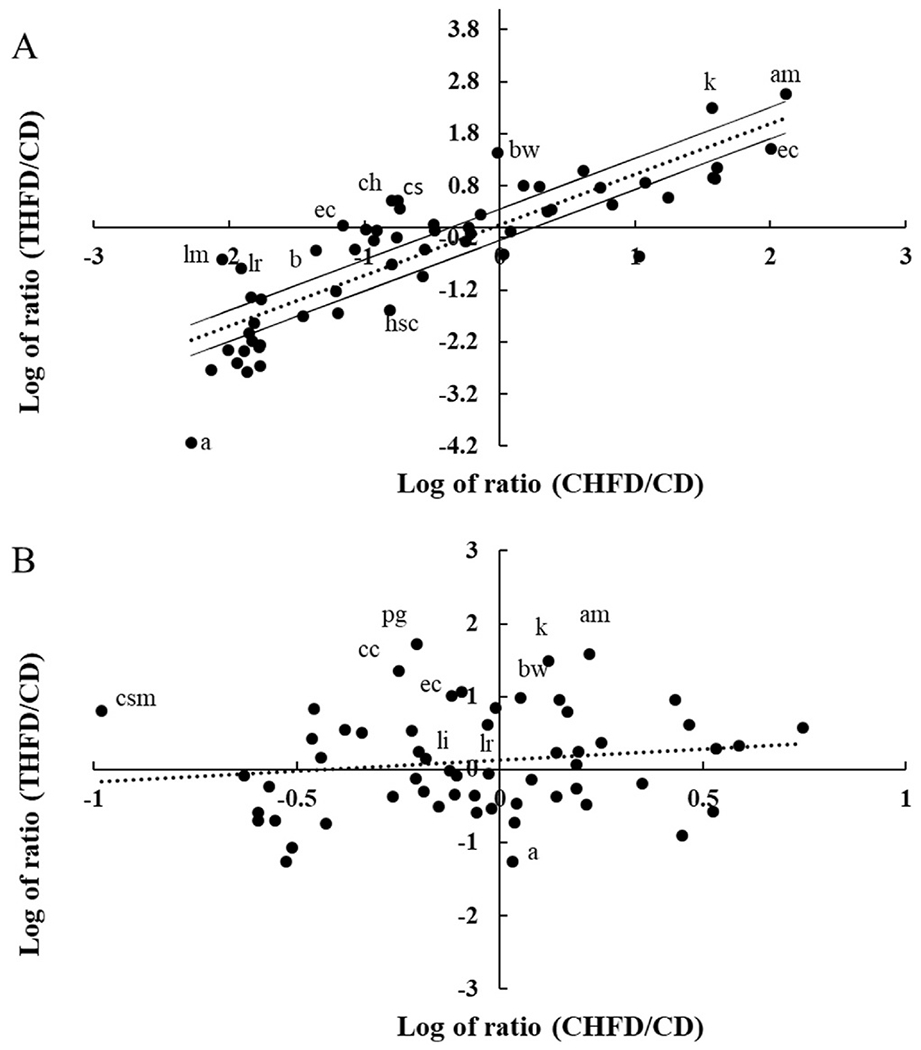
A) Scatter plot of the log ratio of THFD/CD (total counts for species from the Tempol + high fat diet compared to the 6 weeks control chow) vs the log ratio for CHFD/CD (total counts for species on the high fat diet compared to 6 weeks control chow). B) Same conditions as (A) but with anti-biotics added. Dotted line is the linear regression line and solid lines are 2-fold up/down from the calculated regression line. Abbreviations are a: Anaeroplasma spp., ac: Anaerostipes caccae, am: Akkermansia muciniphila, b: Barnesiella spp., bw: Bilophila wadsworthia, cc: Clostridium cocleatum, ch: Clostridium hathewayi, cs: Clostridium symbiosum, csm: Candidatus Stoquefichus massiliensis, ec: Escherichia coli, hs: Hydrogenoanaerobacterium saccharovorans, k: Kopriimonas spp., li: Lactobacillus intestinalis, and lm: Lactobacillus murinus, pg: Parabacteroides goldsteinii.