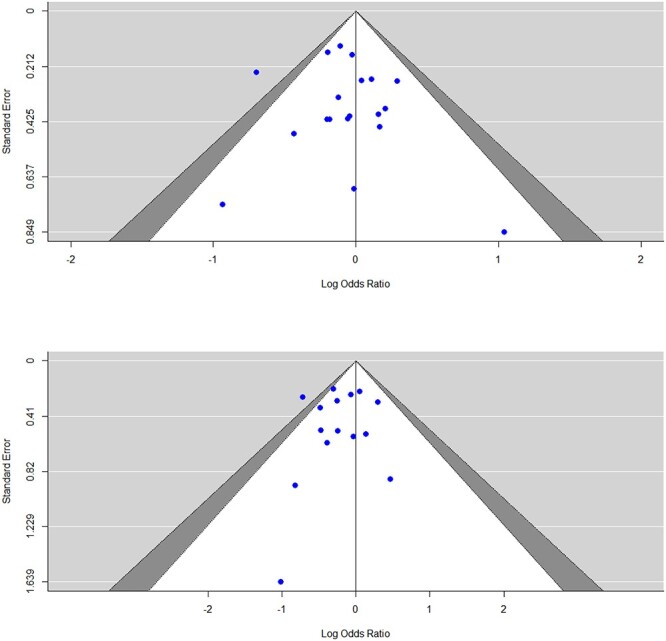
Fig. 3.

Contour-enhanced funnel plots of LORs: Driving after two+/three+ drinks (top) and after four+/five+ drinks (bottom). Filled circles indicate study-specific effect size estimates. When they are outside the triangle, they are statistically significant at P ≤ 0.05. The outer triangle layer in gray shows the area where 0.05 < P ≤ 0.10, and the inner triangle in white indicates the region where 0.10 < P ≤ 1.00.
