
Fig. 4.
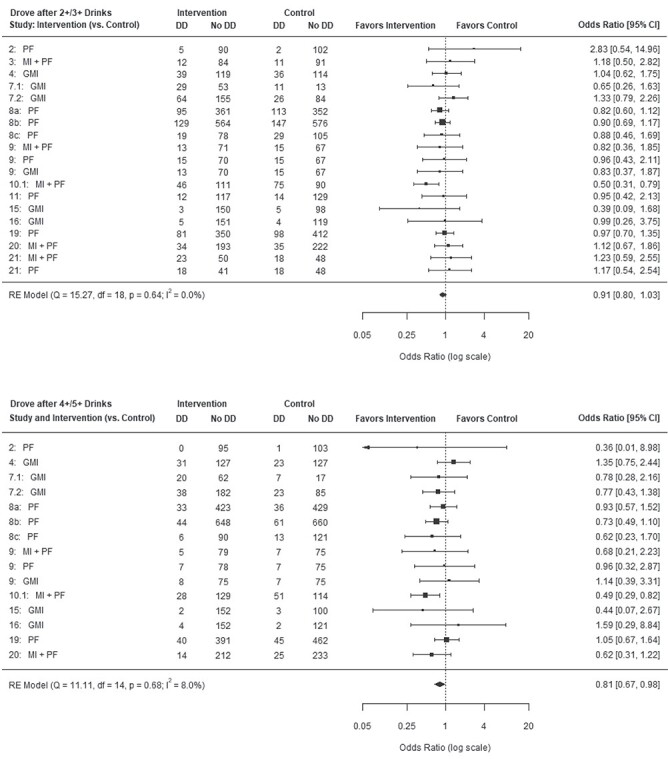
Forest plots of driving after two+/three+ drinks (top) and driving after four+/five+ drinks (bottom). DD, reported driving after drinking; no DD, did not report any driving after drinking.
Official websites use .gov
A
.gov website belongs to an official
government organization in the United States.
Secure .gov websites use HTTPS
A lock (
) or https:// means you've safely
connected to the .gov website. Share sensitive
information only on official, secure websites.
Forest plots of driving after two+/three+ drinks (top) and driving after four+/five+ drinks (bottom). DD, reported driving after drinking; no DD, did not report any driving after drinking.