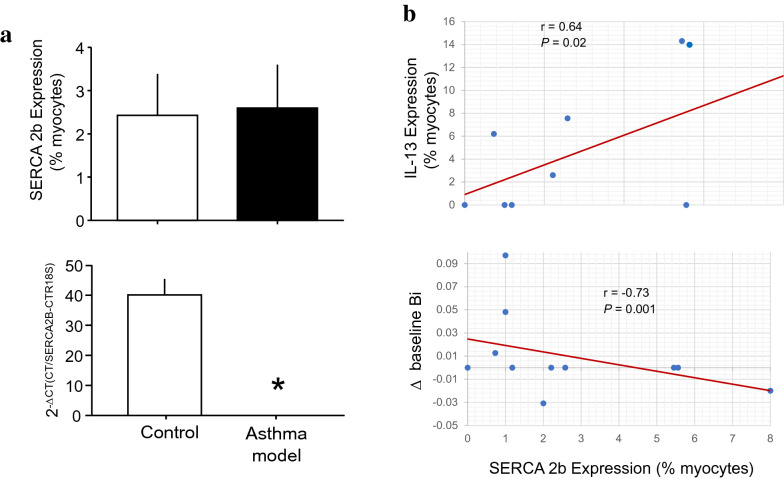
Fig. 6.
SERCA2b expression in asthma model guinea pigs. a Number of isolated airway myocytes that expressed SERCA2b determined by flow cytometry (upper panel). SERCA2B gene expression measured by RT-PCR (lower panel). Scatter graphs showing that the number of myocytes that expressed SERCA2b was correlated (b, upper panel) directly with the number of myocytes that expressed IL-13 and (b, lower panel) inversely with the changes (Δ) in the baseline bronchoobstructive index (Bi). *P = 0.00001 compared with the control (unpaired Student’s t-test). r = Spearman correlation coefficient; P = paired Student’s t-test

