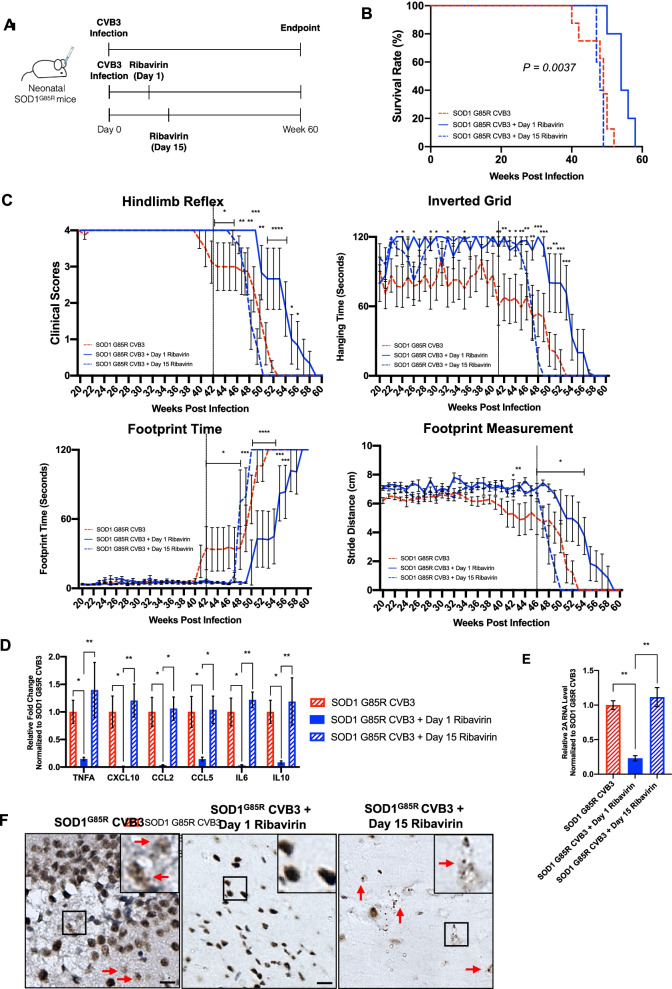
Fig. 5.
CVB3-accelerated ALS progression is mitigated by early antiviral treatment. A Schematic diagram illustrating the experimental plan for CVB3 injection, ribavirin administration, and the endpoint. B Kaplan–Meier plots comparing mouse survivals among SOD1G85R CVB3 (n = 8; male = 2 and female = 6), SOD1G85R CVB3 day 1 ribavirin (n = 5; male = 2 and female = 3), and SOD1G85R CVB3 day 15 ribavirin (n = 5; male = 2 and female = 3) mice. P = 0.0037 between SOD1G85R CVB3 and SOD1G85R CVB3 day 1 ribavirin groups. C Mouse motor function measured weekly (i.e., hindlimb reflex score, inverted grid time, footprint time, and stride distance) starting at week 20 PI until humane or experimental endpoint. The vertical black line indicates the point of deviation between the two groups. D–E RT-qPCR evaluation of proinflammatory genes (D) and viral RNA (E) in the brain tissues collected at week 60 PI or the humane endpoints. F Representative TDP-43 IHC staining images in the hippocampus regions of the brain collected at week 60 PI or the humane endpoint. The red arrows indicate TDP-43 mislocalization. Scale bar = 100 μm. Quantifications are presented as mean ± SEM (n = 3–4). Statistical analysis was carried out by two-way ANOVA, followed by Bonferroni’s multiple comparison test. *, p < 0.05; **, p < 0.01

