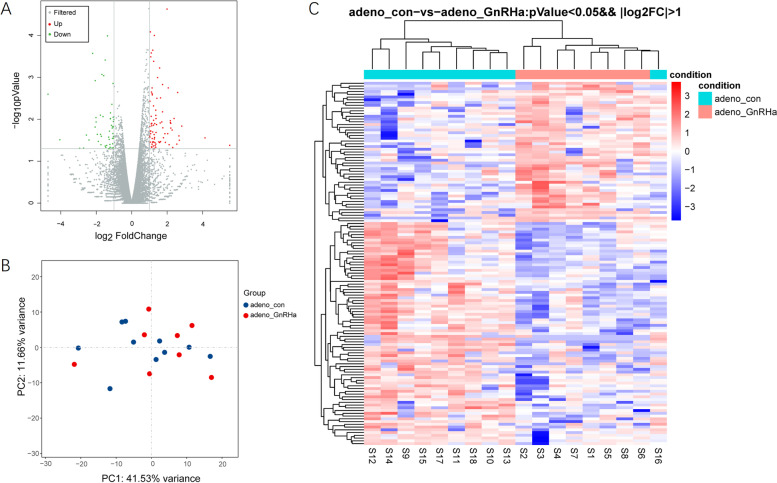
Fig. 1.
DEGs between the eutopic endometrium from patients with adenomyosis treated with GnRHa and matched adenomyosis endometrium samples were identified by RNA-Seq. A, Volcano plots of genes with differential expression. The x axis represents the log2 (fold change), and the y axis represents −log10 (P value), which was calculated by Student’s t test. The red points represent the identified genes with a statistically significant difference in expression (P < 0.05 and fold change ≥2). B, Principal component analysis (PCA). C, Heatmap of genes with differential expression

