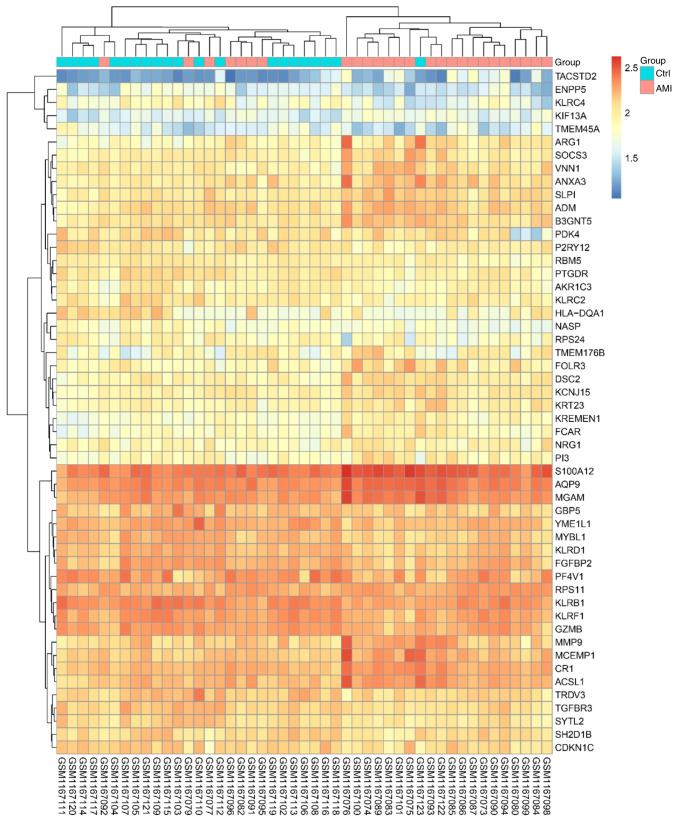
Figure 1.
Heat map of differentially expressed genes in AMI. Columns of the heat map represent individual samples with patients with AMI on the left-hand side and controls on the right-hand side, while rows represent all differentially expressed probe-sets. The heat map's color gradient represents relative expression, with upregulated genes displayed in red and downregulated genes in blue. AMI, acute myocardial infarction; Ctrl, control.

