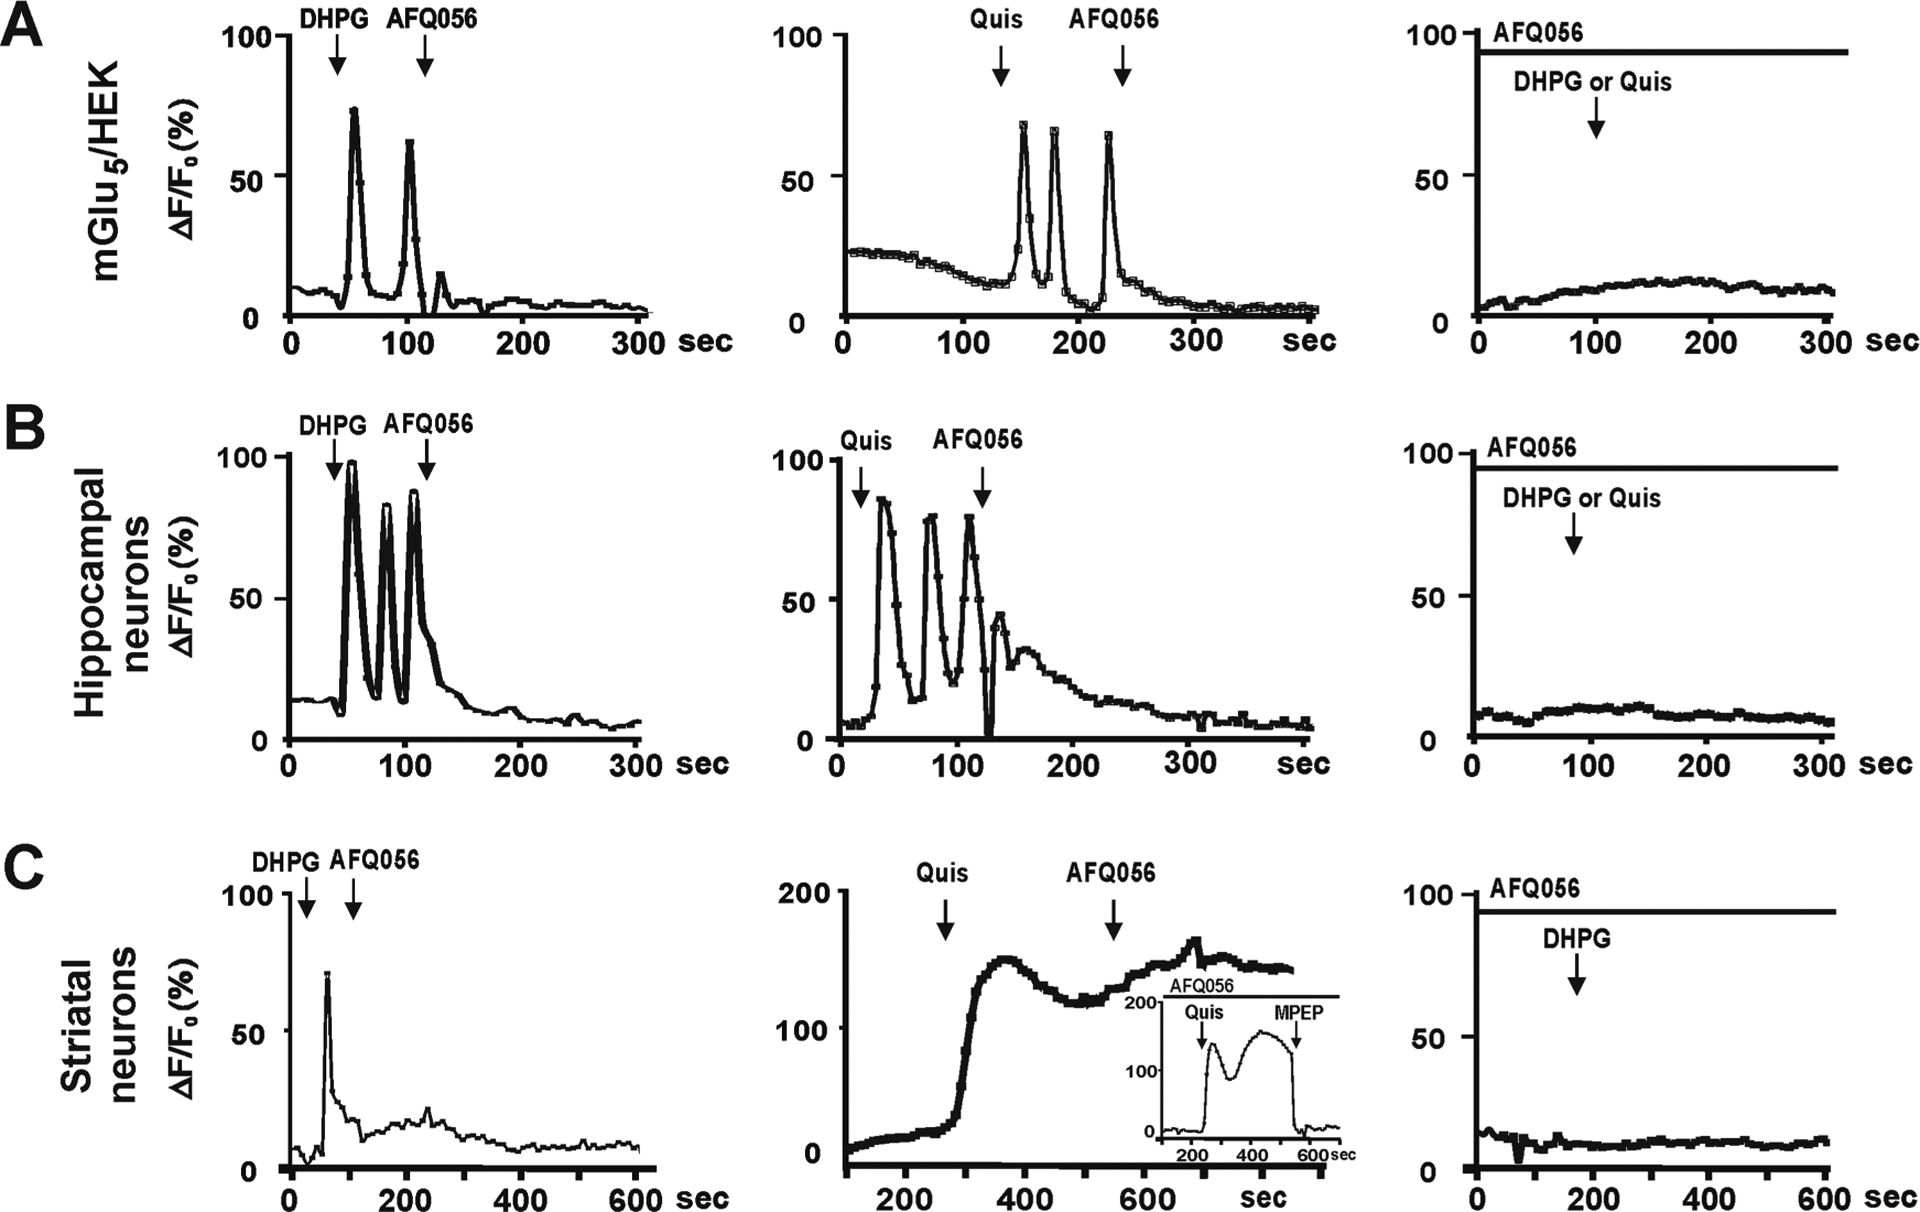
Figure 1.

Single cell imaging of intracellular Ca2+ showing location-dependent bias of various mGlu5 NAMs. (A–C) Traces derived from the mGlu5/HEK cell line, hippocampal, or striatal cultures loaded with Ca2+ fluorophore and then treated as indicated. Traces represent the fractional change in fluorescence relative to the basal level.13–15 (A, Left) Cell surface mGlu5 agonist DHPG generated Ca2+ oscillations in mGlu5/HEK cells which could be blocked by 10 μM AFQ056 (shown) or MPEP, Fenobam, RG7090, or AZD2066 (not shown). (A, Middle) Quis-induced Ca2+ oscillations could also be blocked with AFQ056 as well as the other tested NAMs. (A, Right) Pretreatment of mGlu5/HEK cells with AFQ056 (shown) or MPEP, Fenobam, RG7090, or AZD2066 completely blocked DHPG or Quis-mediated Ca2+ responses. DHPG (B, left) and Quis (B, middle) also induced Ca2+ oscillations in hippocampal neurons which could be blocked by all NAMs. NAM pretreatment (B, right) completely prevented subsequent DHPG or Quis responses. Pre- (C, right) or post- (C, left) treatment with AFQ056 blocked DHPG effects in striatal neurons. (C, Middle) In contrast, AFQ056 did not block Quis-mediated Ca2+ changes in striatal neurons and pretreatment did not prevent a Quis-induced Ca2+ response (inset) Although only single traces are shown here, quantitation (Figure 2) was from 80 to 100 neurons for each condition and each experiment was performed three times. In these experiments, DHPG was applied at 100 μM, Quis at 10 μM, and all NAMs at 1, 5, and 10 μM. In the traces shown, AFQ056 is 10 μM.
