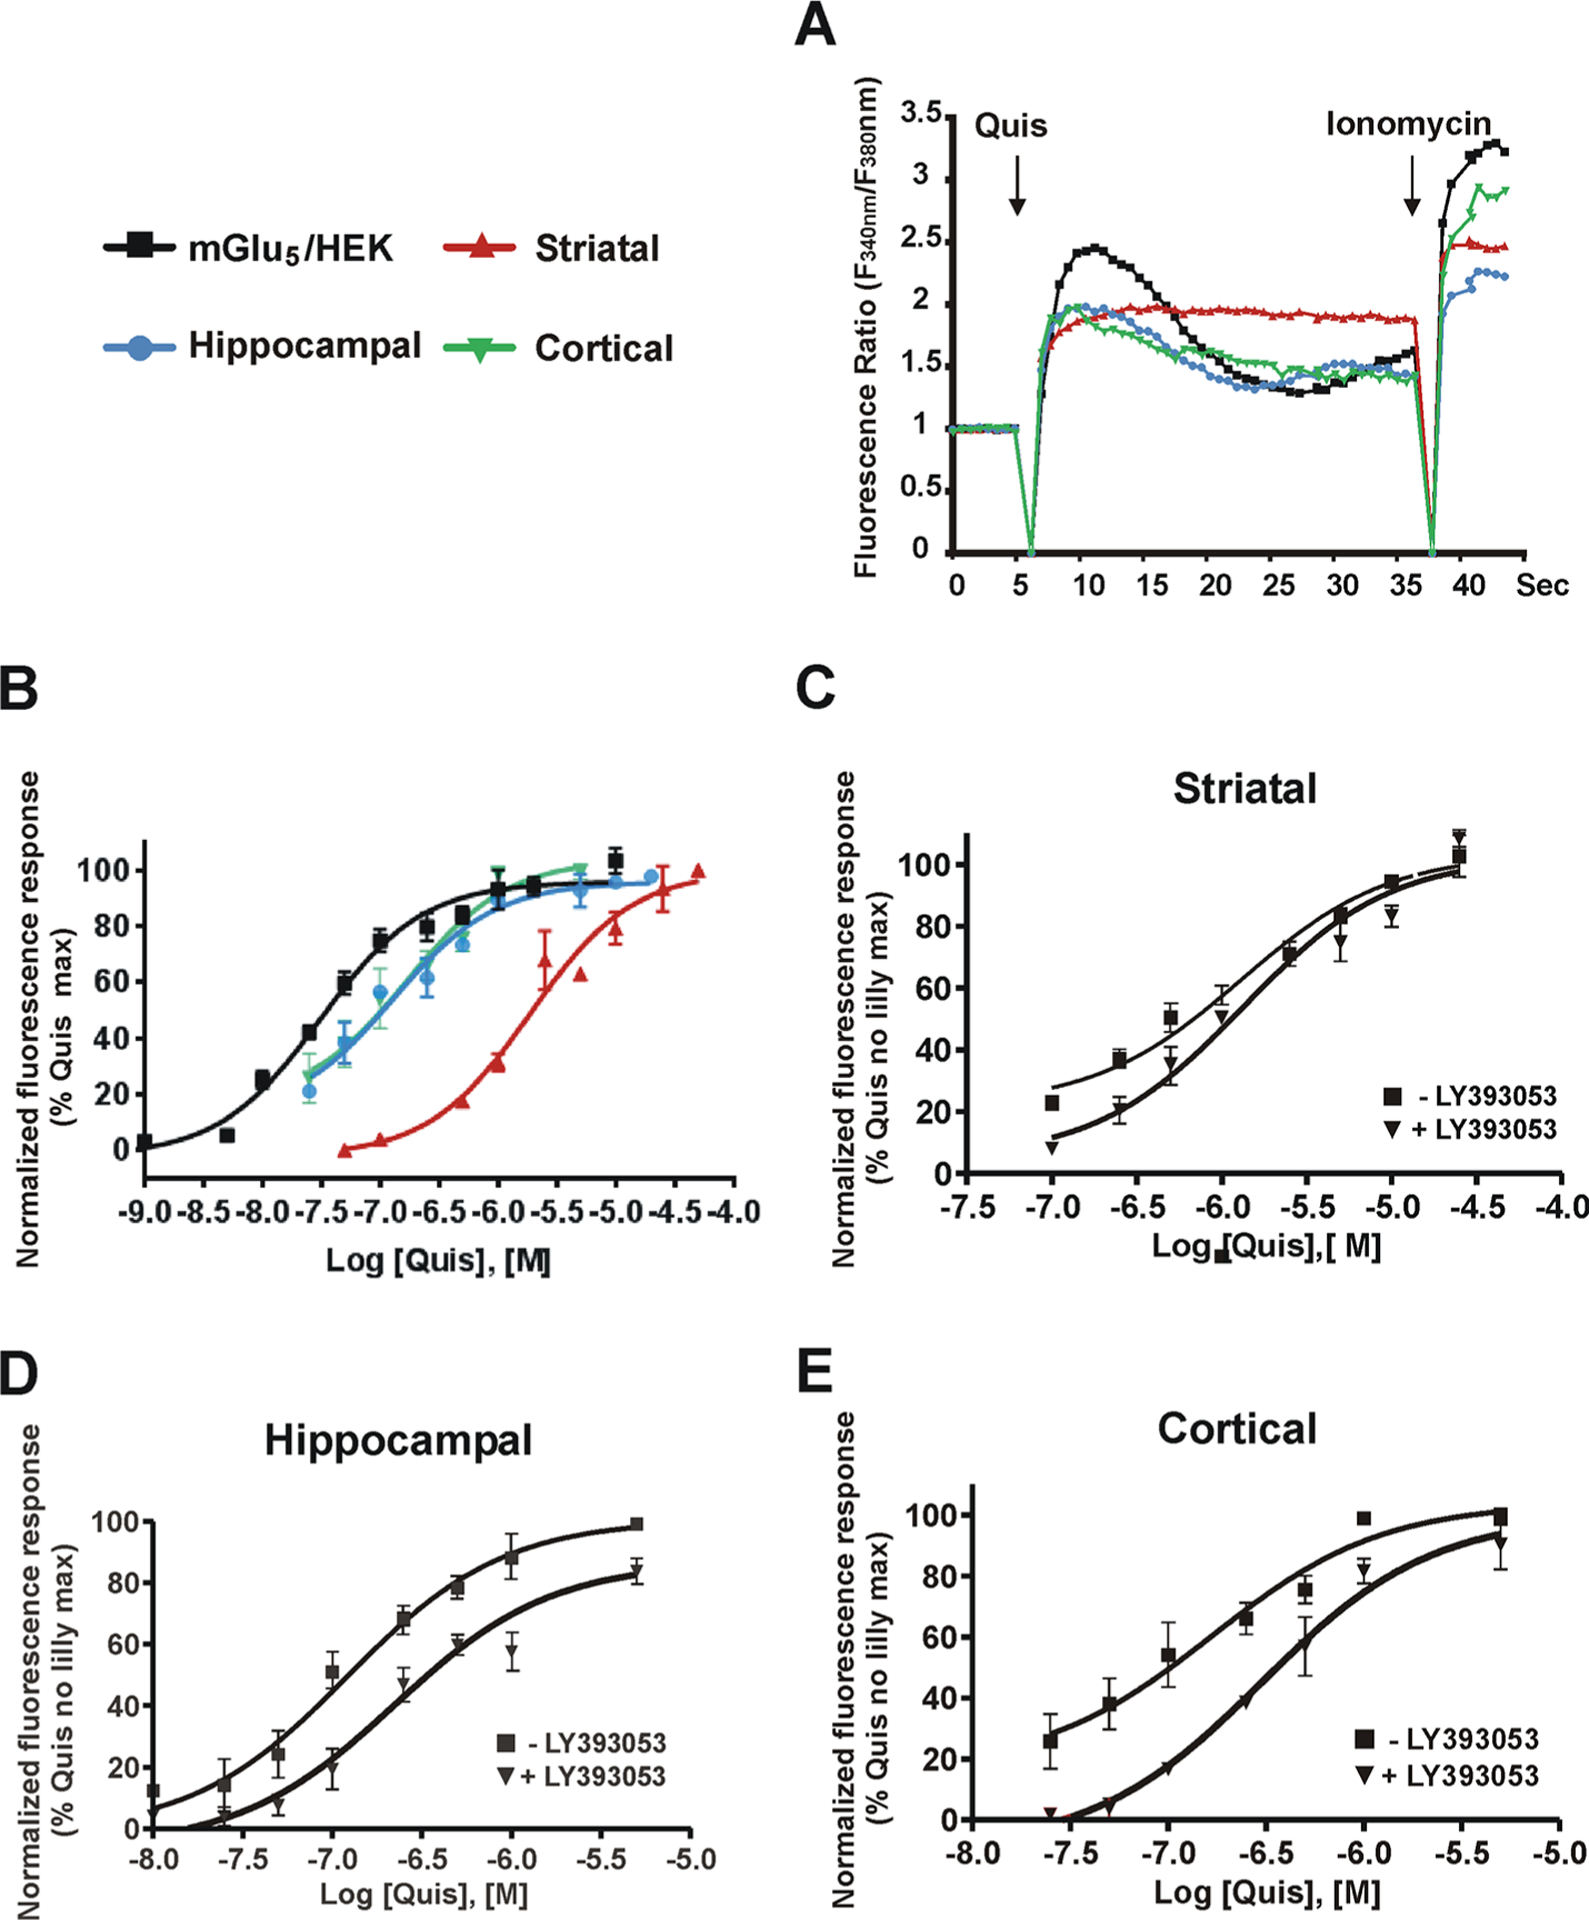
Figure 3.

Quis exhibits cell type-specific Ca2+ responses. Cells were plated in 96-well plates, loaded with the Ca2+ sensitive fluorescent dye Fura-2 AM, and placed in a BioTek Synergy H4 Hybrid microplate reader. A range of concentrations of Quis was added after 5 s of baseline determination. (A) Ca2+ traces from equi-effective concentrations of Quis determined in mGlu5/HEK (black solid square), striatal (red solid up triangle), hippocampal (blue solid circle), or cortical (green solid down triangle) cultures. The Quis-induced response was defined as the average rise of normalized fluorescence ratio between 3 and 5 s after the agonist addition. Ionomycin 2 μM was added at the end to verify Fura-2 AM loading. (B) Dose–response curves of Quis-induced Ca2+ responses. Similar experiments were performed with (black solid down triangle) and without (black solid square) pretreatment with LY393053 followed by various concentrations of Quis in striatal (C), hippocampal (D), or cortical cultures (E). The maximum response induced by the highest Quis concentration applied was set as 100%. Data were normalized to a Quis control maximum. Dose–response curves were generated from mean data sets of at least three independent experiments performed in triplicate. Error bars represent SEM. EC50 values of Quis in all cell types were determined using GraphPad Prism, and the values are summarized in Table 2.
