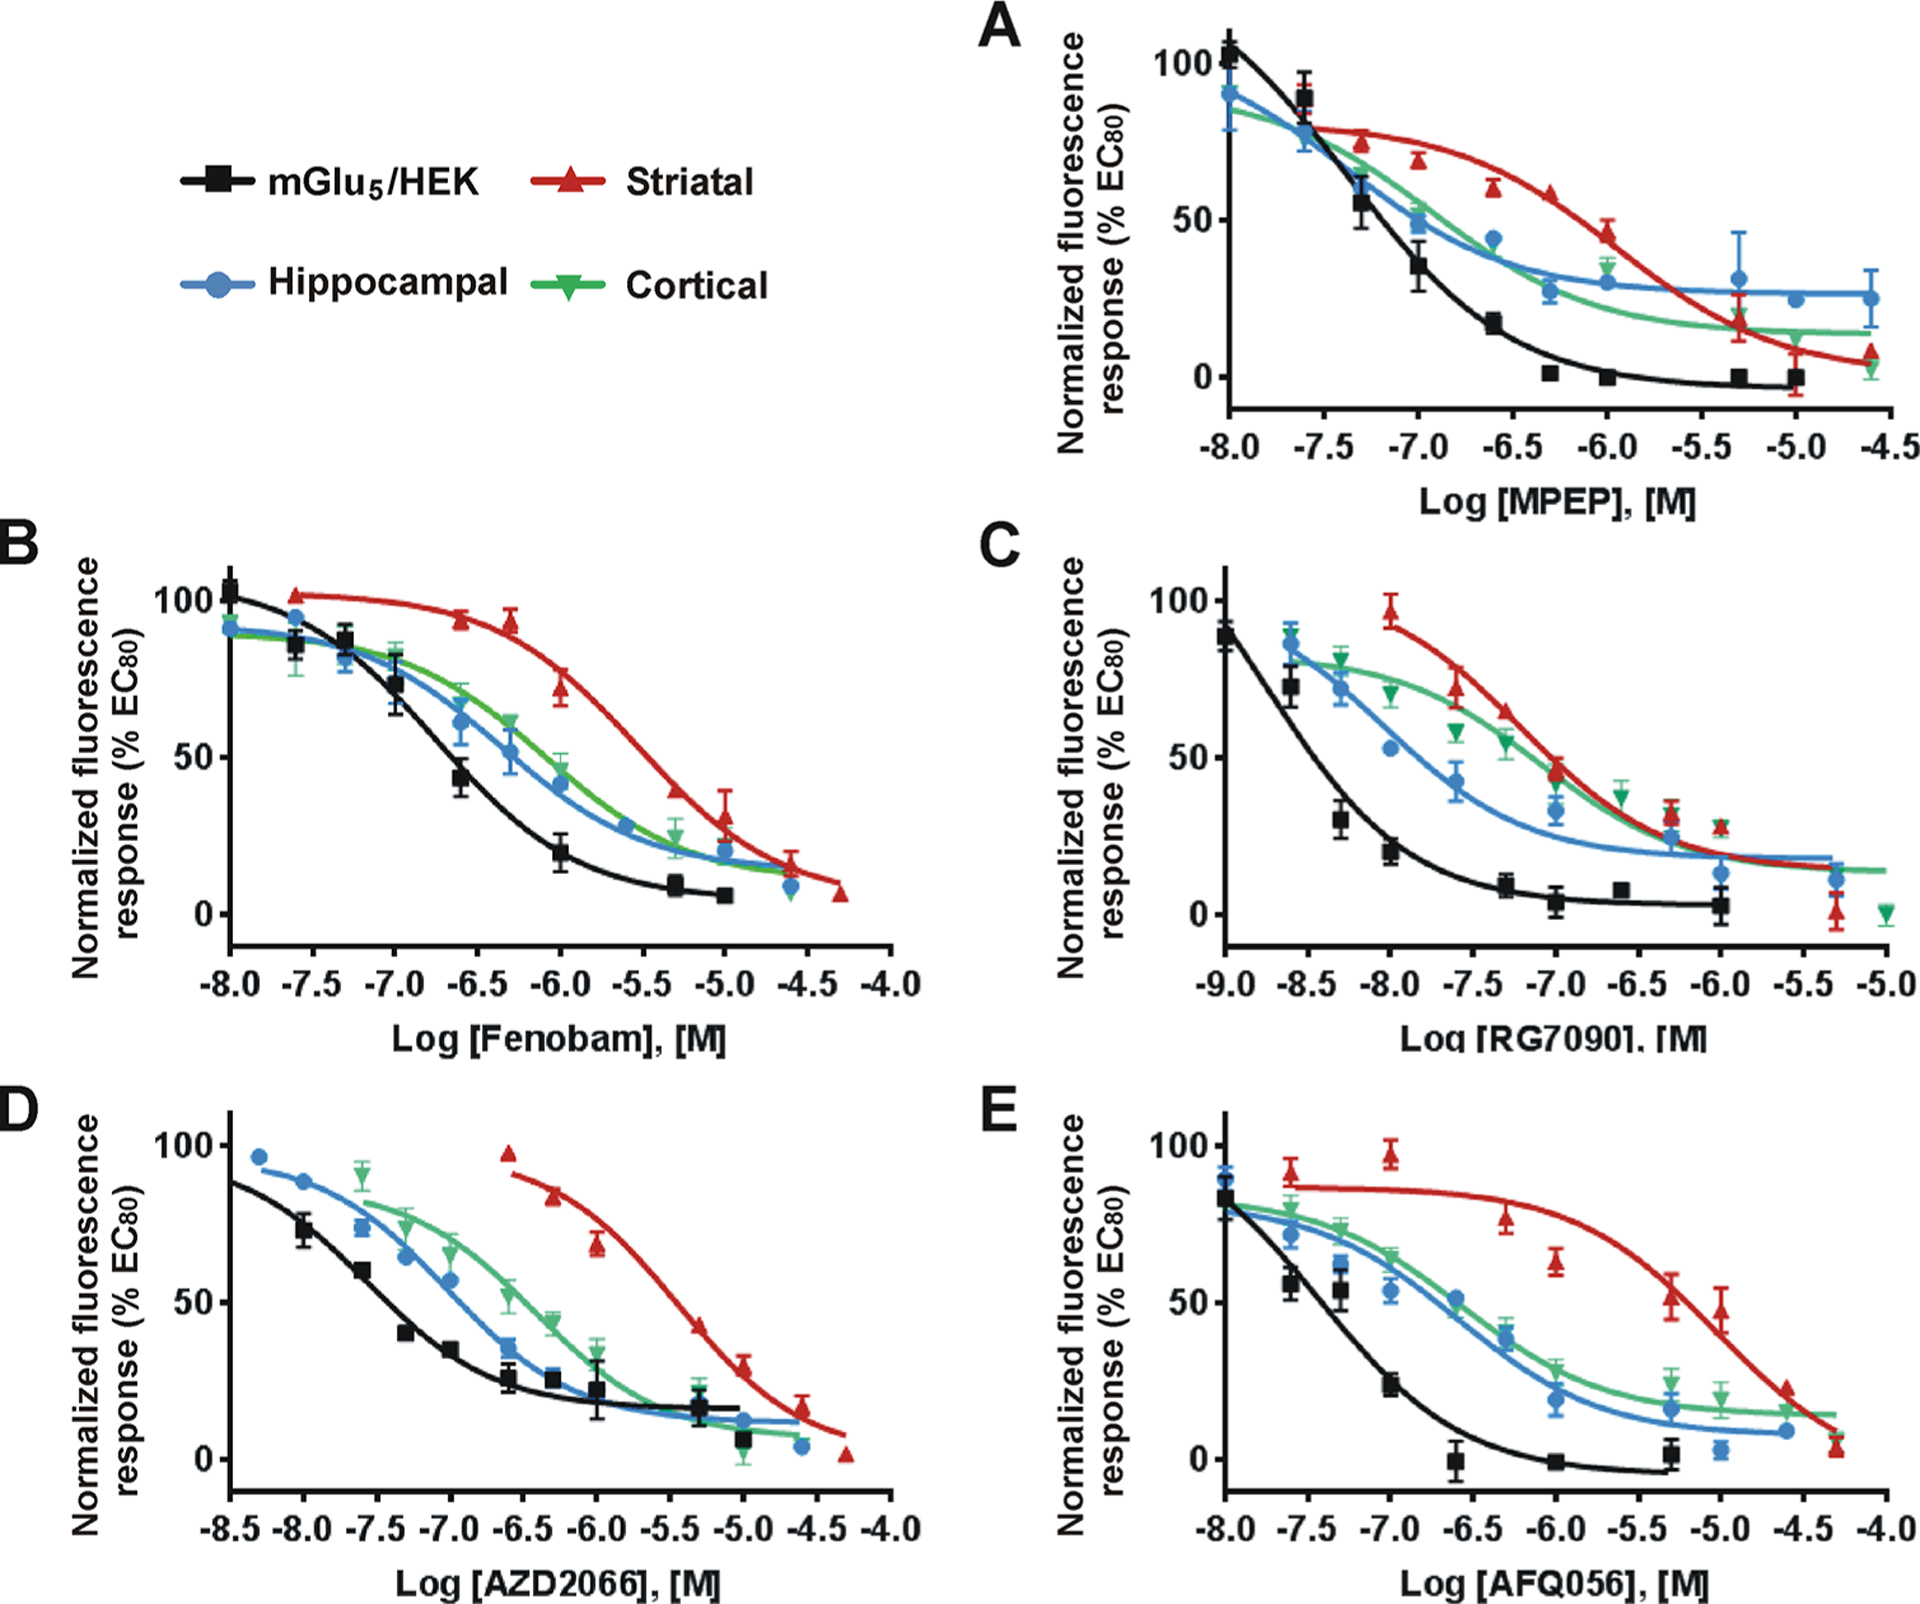
Figure 4.

mGlu5 NAMs exhibit cell type-specific bias. HEK cells expressing mGlu5, striatal, hippocampal, and cortical cultures were prepared as described in Methods. A range of concentrations of mGlu5 NAMs (MPEP, Fenobam, RG7090, AZD2066, and AFQ056) were added to the Fura-2 AM loaded cells in 96-well plates and incubated for 20 min. Quis was added at the cell specific EC80 value determined in Figure 3, and Ca2+ responses were measured as described in Methods. (A–E) Inhibition curves for each NAM are as indicated. Inhibition curves were generated from the mean data of three independent experiments performed in triplicate. Error bars represent SEM. Data are plotted as a percentage of the EC80 response to Quis. IC50 values of each mGlu5 NAM in all cell types were determined using Prism curve fitting software from GraphPad (Table 3).
