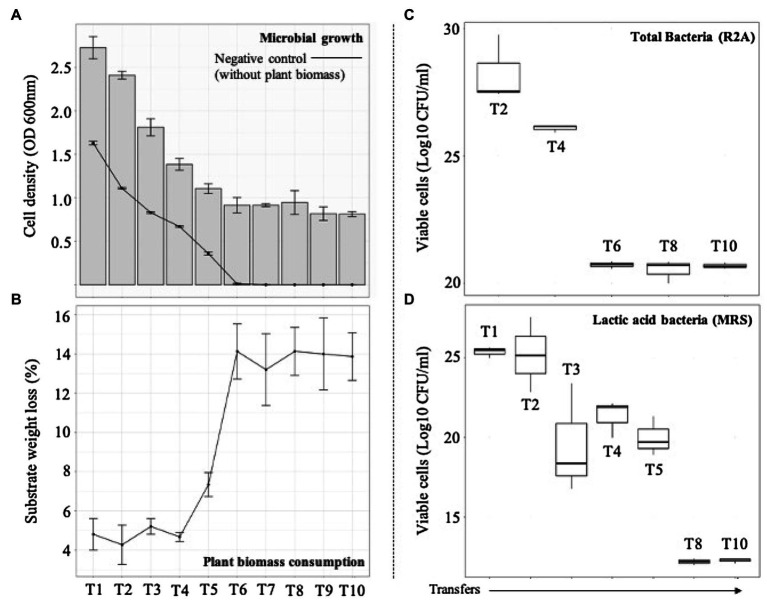
Figure 2.
Microbial growth and plant biomass (PB) degradation values after each sequential growth-dilution steps (T1–T10). (A) Bars show cell density [optical density (OD) at 600nm] and the line shows cell density in the control medium containing no PB. (B) Average substrate weight loss (percent). Error bars represent SDs from three biological replicates. Viable cells (Log10 CFU/ml) of (C) total and (D) acid lactic bacteria quantified in agar R2A and MRS, respectively.

