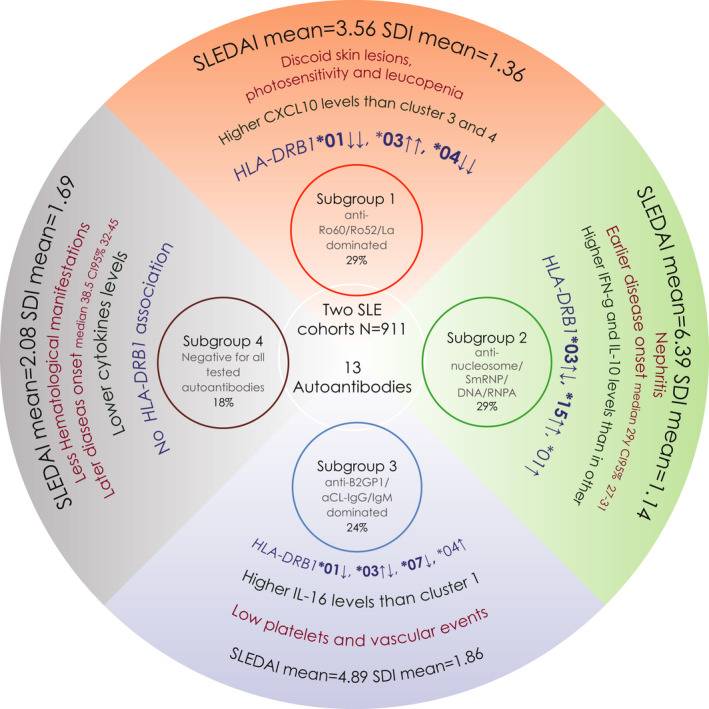
Figure 3.

Representation of the four systemic lupus erythematosus (SLE) disease subgroups identified in the present study. The HLA‐DRB1 alleles in bold text represent significant associations observed in the cases‐versus‐controls analysis; regular text represents significant associations observed in the cases versus cases analysis. The arrows pointing upwards symbolize a risk association, whereas the arrows pointing downwards symbolize a protective association. When two arrows appear, it means that the association between that subgroup with the given allele was observed in both types of analyses (ie, cases versus controls and cases versus cases). The HLA‐DRB1*03 allele was significantly associated with Subgroups 1, 2, and 3 for both types of analyses (ie, cases versus controls and cases versus cases); therefore, the first arrow closed to that allele symbolize the direction of the association in the cases‐versus‐controls analysis, the second arrow indicates the direction of the association observed in the cases versus cases analysis. Note that the arrows have the same direction only for Subgroup 1. Remarkably, Subgroup 2 is characterized by core SLE features; Subgroups 1 and 3 have convincing similarities to the primary Sjögren's syndrome and the primary antiphospholipid syndrome (pAPS), respectively; and Subgroup 4 is a milder version with fewer autoantibodies and no HLA‐DRB1 association. On the basis of these observations, we suggest that the autoantibody profile can be used to classify the presently diagnosed patients with SLE into several more homogeneous subgroups, and this approach should be considered when designing future therapeutic trials. SDI, Systemic Lupus International Collaborating Clinics/American College of Rheumatology Damage Index; SLEDAI, SLE Disease Activity Score.
