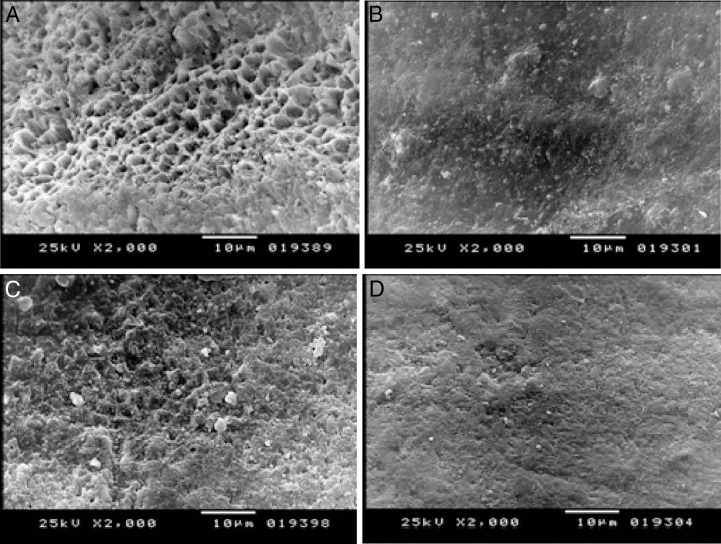
Figure 1.
(A) Scanning electron micrograph showing the demineralization in the enamel surface in the Coca-Cola group (2000× magnification). (B) Scanning electron micrograph showing the demineralization in the enamel surface in the Coca-Cola group with Icon (2000× magnification). (C) Scanning electron micrograph showing the demineralization in the enamel surface in the Sprite group (2000× magnification). (D) Scanning electron micrograph showing the demineralization in the enamel surface in the Sprite group with Icon (2000× magnification).

