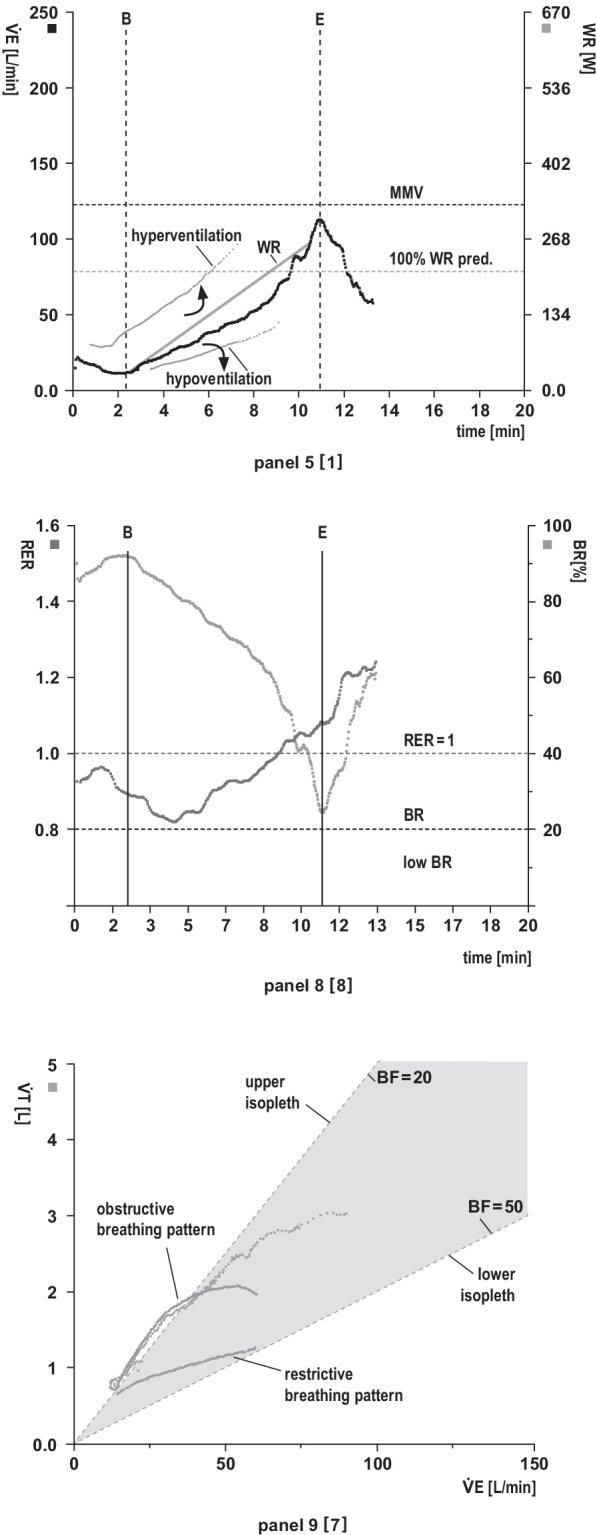
Fig. 4.

Ventilatory response panels
Panel 5: Relationship between minute ventilation () and work rate (WR) vs. time (x-axis). The maximum voluntary ventilation (MVV) is calculated indirectly as forced expiratory volume in 1 s (FEV1) × 40 or can be determined by direct measurement of MVV (preferred option in restrictive lung disease). Exercise is usually not limited by breathing.
Analysis (target values and response kinetics): Is adequate relative to work rate (see main text: validity check, 9-point rule)? Is vs. work rate sharply increased at the start of exercise (suggestive of R-L shunting) or decreased (e.g., mask or mouthpiece leakage)? Impaired ability to increase in response to enhanced CO2 production and/or acidaemia (e.g., severe lung disease, obesity)?
Panel 8: Respiratory exchange rate (RER) and breathing reserve (BR). RER describes the ratio of CO2 output to O2 uptake (/) as a function of time and reflects patient effort (RER at least ≥ 1). RER depends on the rate of lactate increase during progressive exercise. BR indicates the actual percentage of the maximum ventilatory capacity (MVV-V̇E). Validity depends on adequate spirometry.
Analysis (target values and response kinetics): RER values at rest: normal, high or low? RER > 1 at rest (indicative of hyperventilation). RER ≥ 1 achieved in early exercise (work rate already above lactate threshold) or in late exercise? An abrupt, persistent RER increase during early exercise suggests exercise-induced R-L shunt. RER < 1 during exercise (e.g., poor effort, severe lung disease [ cannot be adequately increased], myopathy, PAD, hyperventilation prior to testing)? Delayed decrease in RER in early recovery (indicates delayed CO2 elimination, e.g., severe COPD) or rapid RER decrease in early recovery (indicates delayed recovery of vs. due to a high O2 deficit during exercise)? BR normal or low? A low BR indicates reduced ventilatory capacity due to impaired lung mechanics and increased ventilatory demands during exercise.
Panel 9: Breathing pattern. Relationships of tidal volume (VT) (y-axis), minute ventilation () (x-axis) and breathing frequency (BF). BF is indirectly presented in the form of isopleths (= line with the same numerical values. Upper isopleth: low BF [= 20 breaths/min]. Lower isopleth: high BF [= 50 breaths/min]). Physiologically, V̇E increases until VT is fully utilised (≈ 60% of VC), thereafter V̇E increases with a rise in BF.
Analysis (target values and response kinetics): Normal breathing pattern? The values in the area of the upper isopleths indicate a high VT and a low BF. Obstructive breathing pattern? The increase in ventilation during exercise is limited because VT is already fully utilised and eventually falls off. BF cannot be adequately increased due to the prolonged expiration time. This results in slow, deep breathing. Restrictive breathing pattern? The increase in ventilation during exercise is limited because VT cannot be sufficiently increased due to the reduced lung volume (VT/IC ratio ↑ [> 0.8]). Hence, ventilation can only be increased by elevated BF. VT runs low and flat in the direction of the lower isopleth. This results in rapid, shallow breathing.
