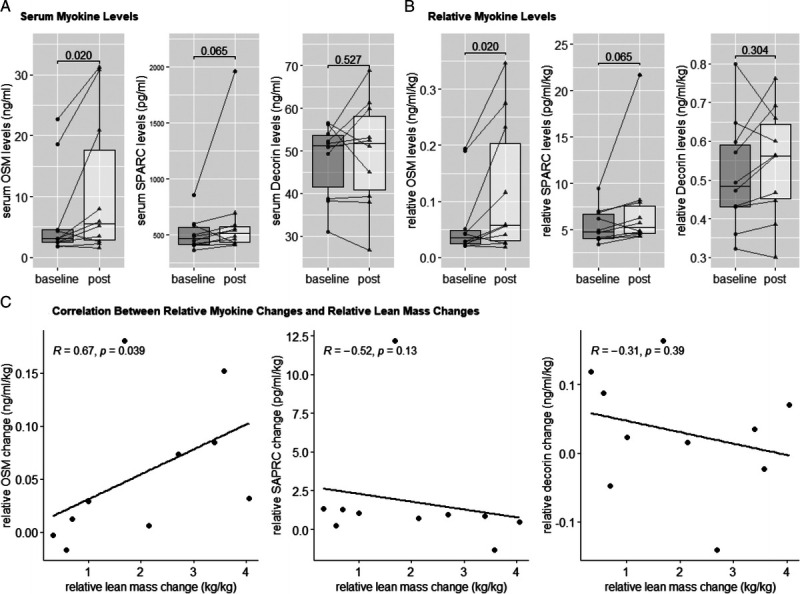
FIGURE 3.

Serum myokine levels. A, Serum levels of OSM, SPARC, and decorin. B, Relative serum levels of OSM, SPARC, and decorin (serum myokine levels/total body mass). *Significant changes over a 12-wk exercise intervention. C, Correlation analysis of change values of relative myokine (OSM, SPARC, and decorin) levels and change values of relative LM over a 12-wk exercise intervention. Lines and dots indicate individual data, with box-and-whisker representation of the whole group; P values are presented for each comparison. Spearman R and P values are indicated for each correlation.
