. 2022 Jan 12;130(1):017005. doi: 10.1289/EHP9373

Figure 2.

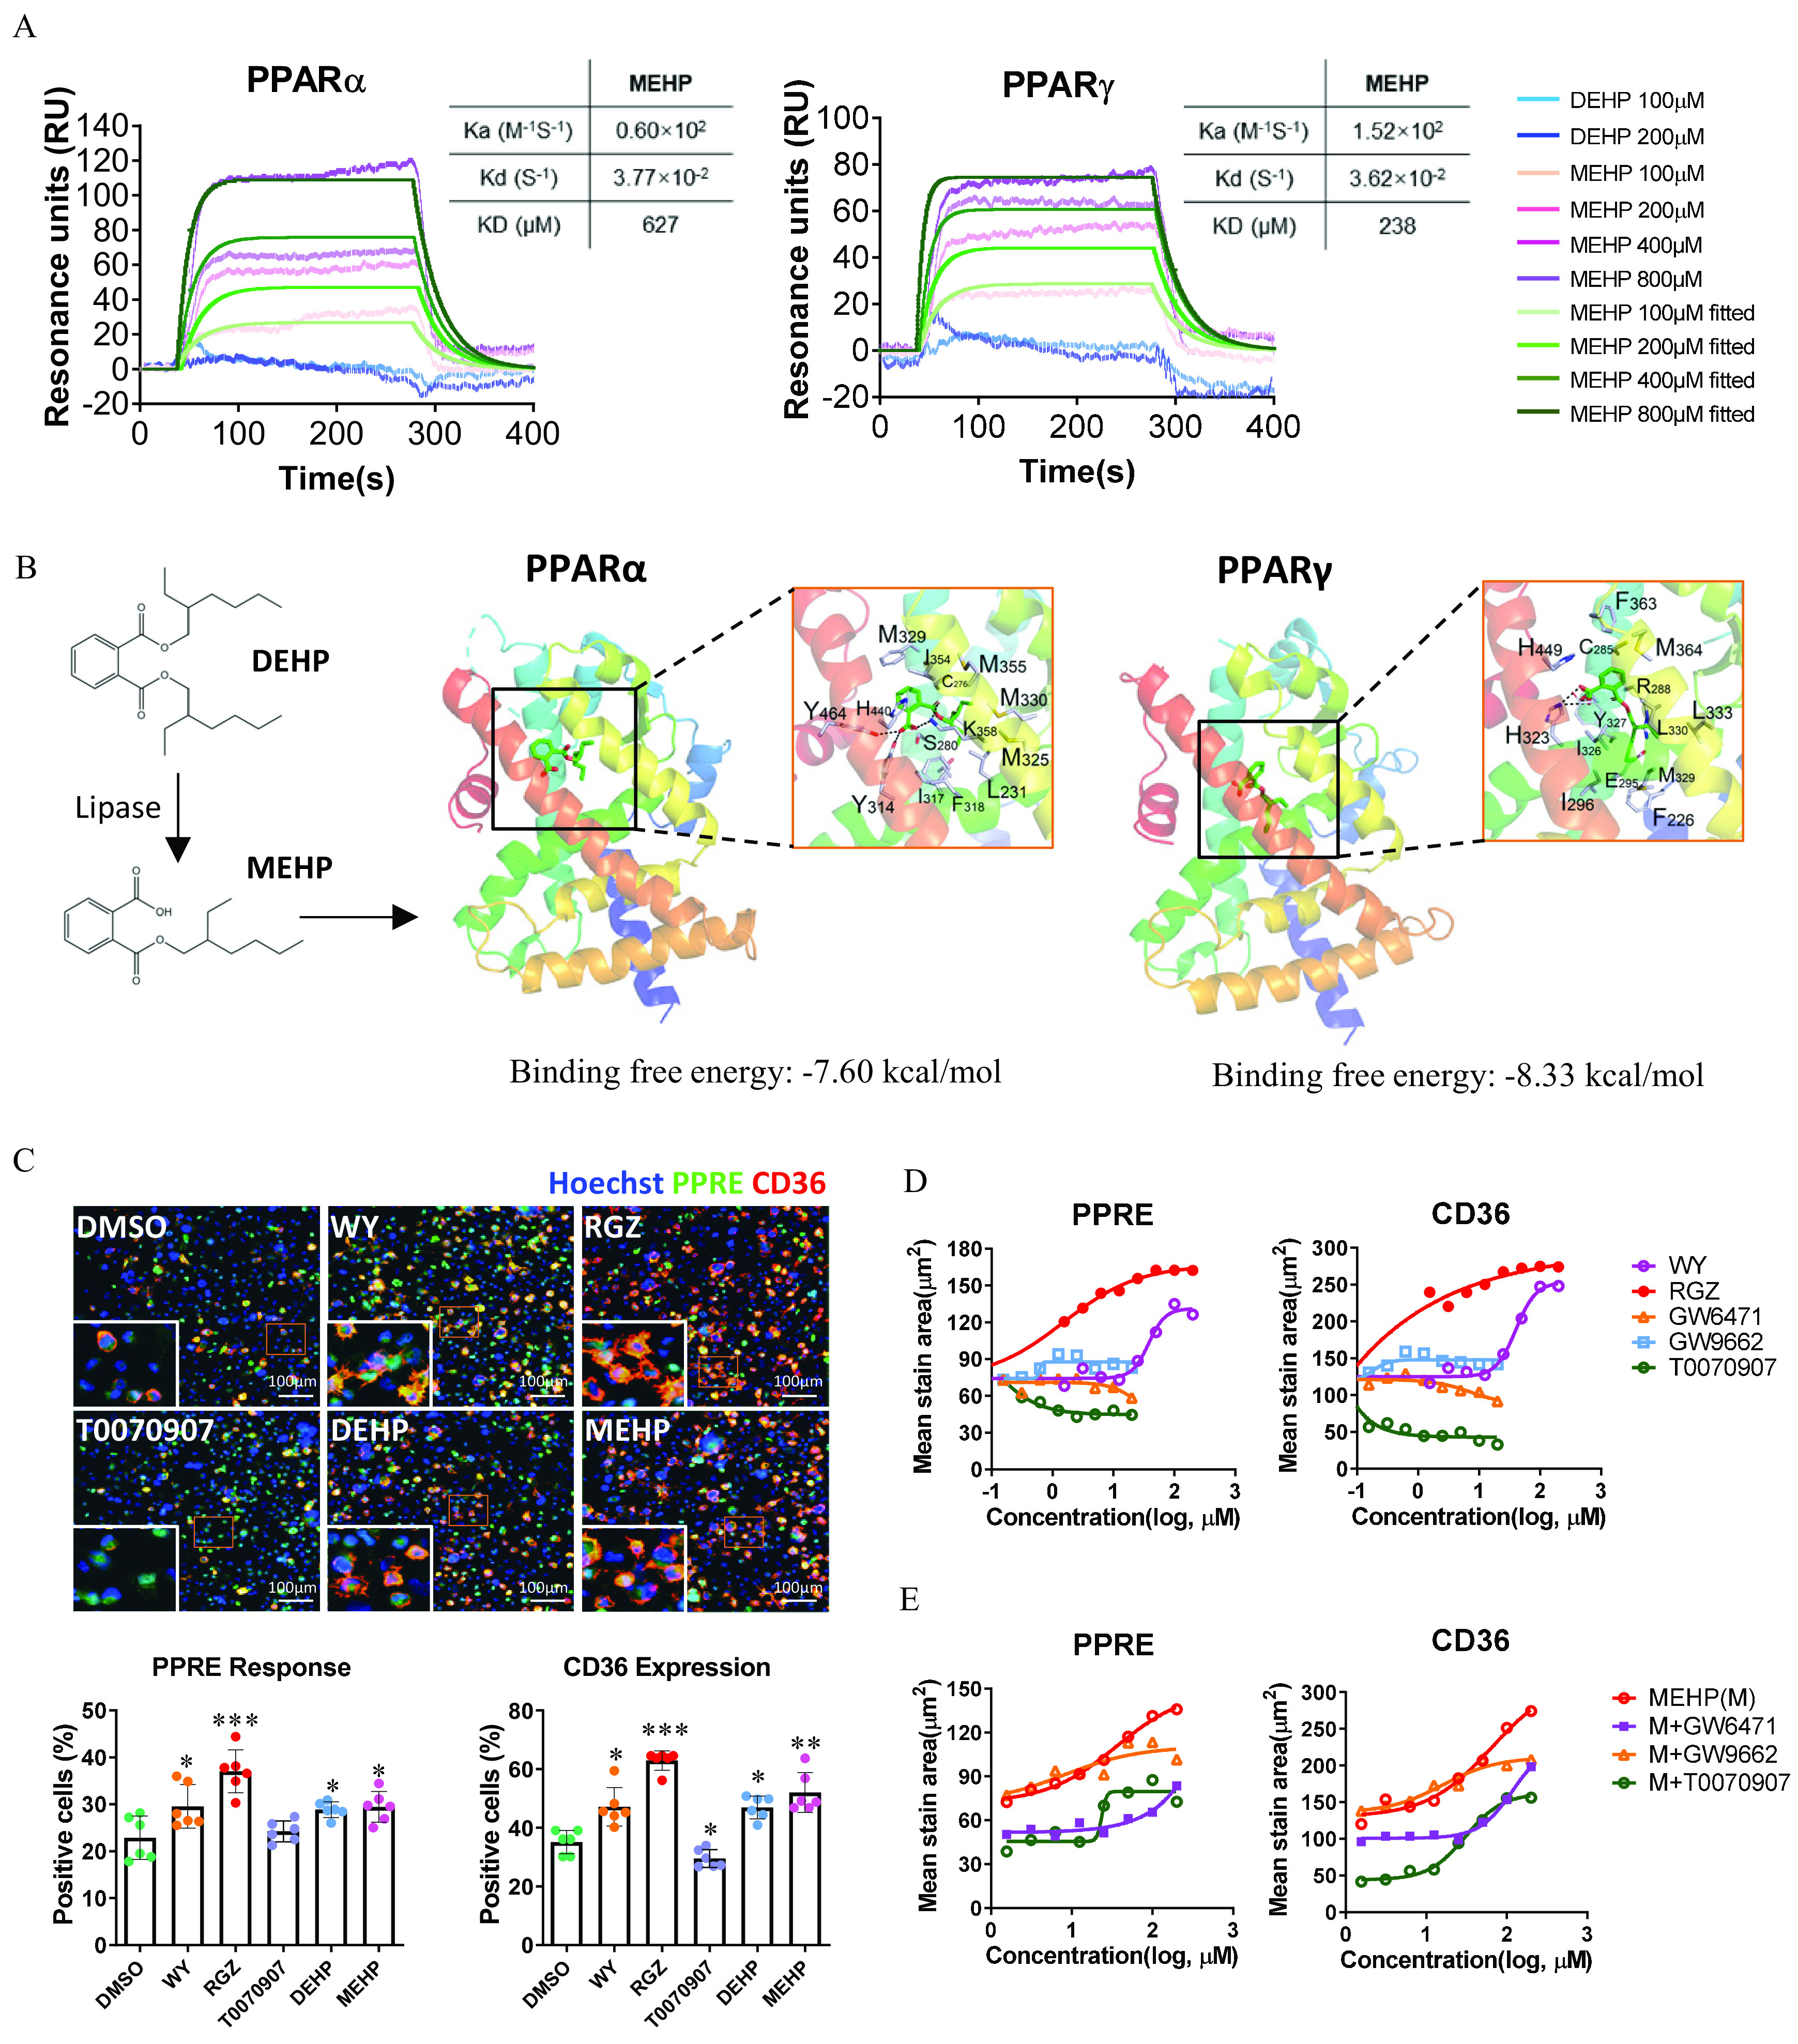
Figure 2A is a set of two Sensorgram graphs titled peroxisome proliferator-activated receptor lowercase alpha and peroxisome proliferator-activated receptor lowercase gamma, plotting Resonance units (R U), ranging from negative 20 to 140 in increments of 20 and negative 20 to 100 in increments of 20 (y-axis) across Time(s), ranging from 0 to 400 in increments of 100 (x-axis) for diethylhexyl phthalate 100 micromolar, diethylhexyl phthalate 200 micromolar, mono(2-ethylhexyl) phthalate 100 micromolar, mono(2-ethylhexyl) phthalate 200 micromolar, mono(2-ethylhexyl) phthalate 400 micromolar, mono(2-ethylhexyl) phthalate 800 micromolar, mono(2-ethylhexyl) phthalate 100 micromolar fitted, mono(2-ethylhexyl) phthalate 200 micromolar fitted, mono(2-ethylhexyl) phthalate 400 micromolar fitted, and mono(2-ethylhexyl) phthalate 800 micromolar fitted, respectively. Figure 2B is a set of three scientific illustrations. The first illustration depicts a chemical formula icon where lipase acts on diethylhexyl phthalate to yield mono(2-ethylhexyl) phthalate. The second and third illustrations titled peroxisome proliferator-activated receptor lowercase alpha and peroxisome proliferator-activated receptor lowercase gamma displays the proteins as ribbons, and small molecules as sticks with binding free energy equals negative 7.60 kilocalories per mole and negative 8.33 kilocalories per mole, respectively. Figure 2C is one set of stained tissues and two bar graphs. The stained tissue displays three columns and two rows depicting Hoechst, peroxisome proliferator-activated receptor response element, and C D 36 in dimethyl sulfoxide, W Y, R G Z, T 0070907, diethylhexyl phthalate, and mono(2-ethylhexyl) phthalate with a scale bar of 100 micrometers. The two bar graphs titled peroxisome proliferator-activated receptor response element response and C D 36 expression, plotting positive cells (percentage), 0 to 50 in increments of 10 and 0 to 80 in increments of 20 (y-axis) across dimethyl sulfoxide, W Y, R G Z, T 0070907, diethylhexyl phthalate, and mono(2-ethylhexyl) phthalate (x-axis), respectively. Figure 2D is a set of two line graphs titled peroxisome proliferator-activated receptor response element and C D 36, plotting mean stain area (micrometers squared), ranging from 0 to 180 in increments of 30 and 0 to 300 in increments of 50 (y-axis) across concentration (log, micromolar), negative 1 to 3 in unit increments (x-axis) for W Y, R G Z, G W 6471, G W 9662, and T 0070907, respectively. Figure 2E is a set of two line graphs titled peroxisome proliferator-activated receptor response element and C D 36, plotting mean stain area (micrometers squared), ranging from 0 to 150 in increments of 30 and 0 to 300 in increments of 50 (y-axis) across concentration (log, micromolar), 0 to 3 in unit increments (x-axis) for W Y, R G Z, G W 6471, G W 9662, and T 0070907, respectively.

Determination of human PPARα and PPARγ activation by DEHP and MEHP at the molecular and cellular levels. (A) Sensorgrams are shown of the binding responses of DEHP and MEHP with human PPARα or PPARγ proteins. The binding affinity was determined using surface plasmon resonance (SPR). The data are provided in Tables S8 and S9. (B) Molecular docking simulation for the ligand–protein binding of MEHP with human PPARα and PPARγ. The proteins are displayed as ribbons, and small molecules are displayed as sticks. (C) High-content imaging (up) and quantification (down) of PPRE response and CD36 expression in the PPRE-eGEP-THP-1–derived macrophages. The cells were treated with Wy14643 (WY; 20μM), rosiglitazone (RGZ; 10μM), T0070907 (2μM), DEHP (200μM), and MEHP (200μM) for 24 h. The number of cells with positive staining of PPRE activation (green) and CD36 expression (red) were normalized to the total cells (blue, stained with Hoechst 33342) in each of triplicate wells (the plots contain all technical replicates from two imaging sites of each well). Data are expressed as mean+SD. The data are provided in Table S10. The data were analyzed using one-way ANOVA followed by Dunnett’s multiple comparisons test. *p<0.05, **p<0.01, ***p<0.001 compared with the vehicle control (DMSO). (D) Dose–response curves of PPRE activation and CD36 expression for selective PPARs ligands. The PPRE-eGEP-THP-1–derived macrophages were treated with selective PPARs ligands at various concentrations of WY (0100μM), RGZ (0100μM), GW6471 (020μM), GW9662 (020μM), or T0070907 (020μM) in replicate wells (n=5) for 24 h. The summary data are provided in Tables S11 and S12. (E) Dose–response curves of PPRE activation and CD36 expression for MEHP. PPRE-eGEP-THP-1–derived macrophages were treated with MEHP (M; 0200μM) alone or in combination with GW6471 (10μM), GW9662 (10μM), or T0070907 (10μM) in replicate wells (n=3) for 24 h. The summary data are provided in Table S13. The fluorescent stain of PPRE-eGFP and CD36 were analyzed using high-content cellular imaging, as described in the “Methods” section. Log10 values of concentrations were used. Note: ANOVA, analysis of variance; DEHP, diethylhexyl phthalate; DMSO, dimethyl sulfoxide; MEHP, mono(2-ethylhexyl) phthalate; PPAR, peroxisome proliferator-activated receptor; PPRE, peroxisome proliferator-activated receptor response element; RU, resonance unit; SD, standard deviation.