. 2022 Jan 12;130(1):017005. doi: 10.1289/EHP9373

Figure 4.

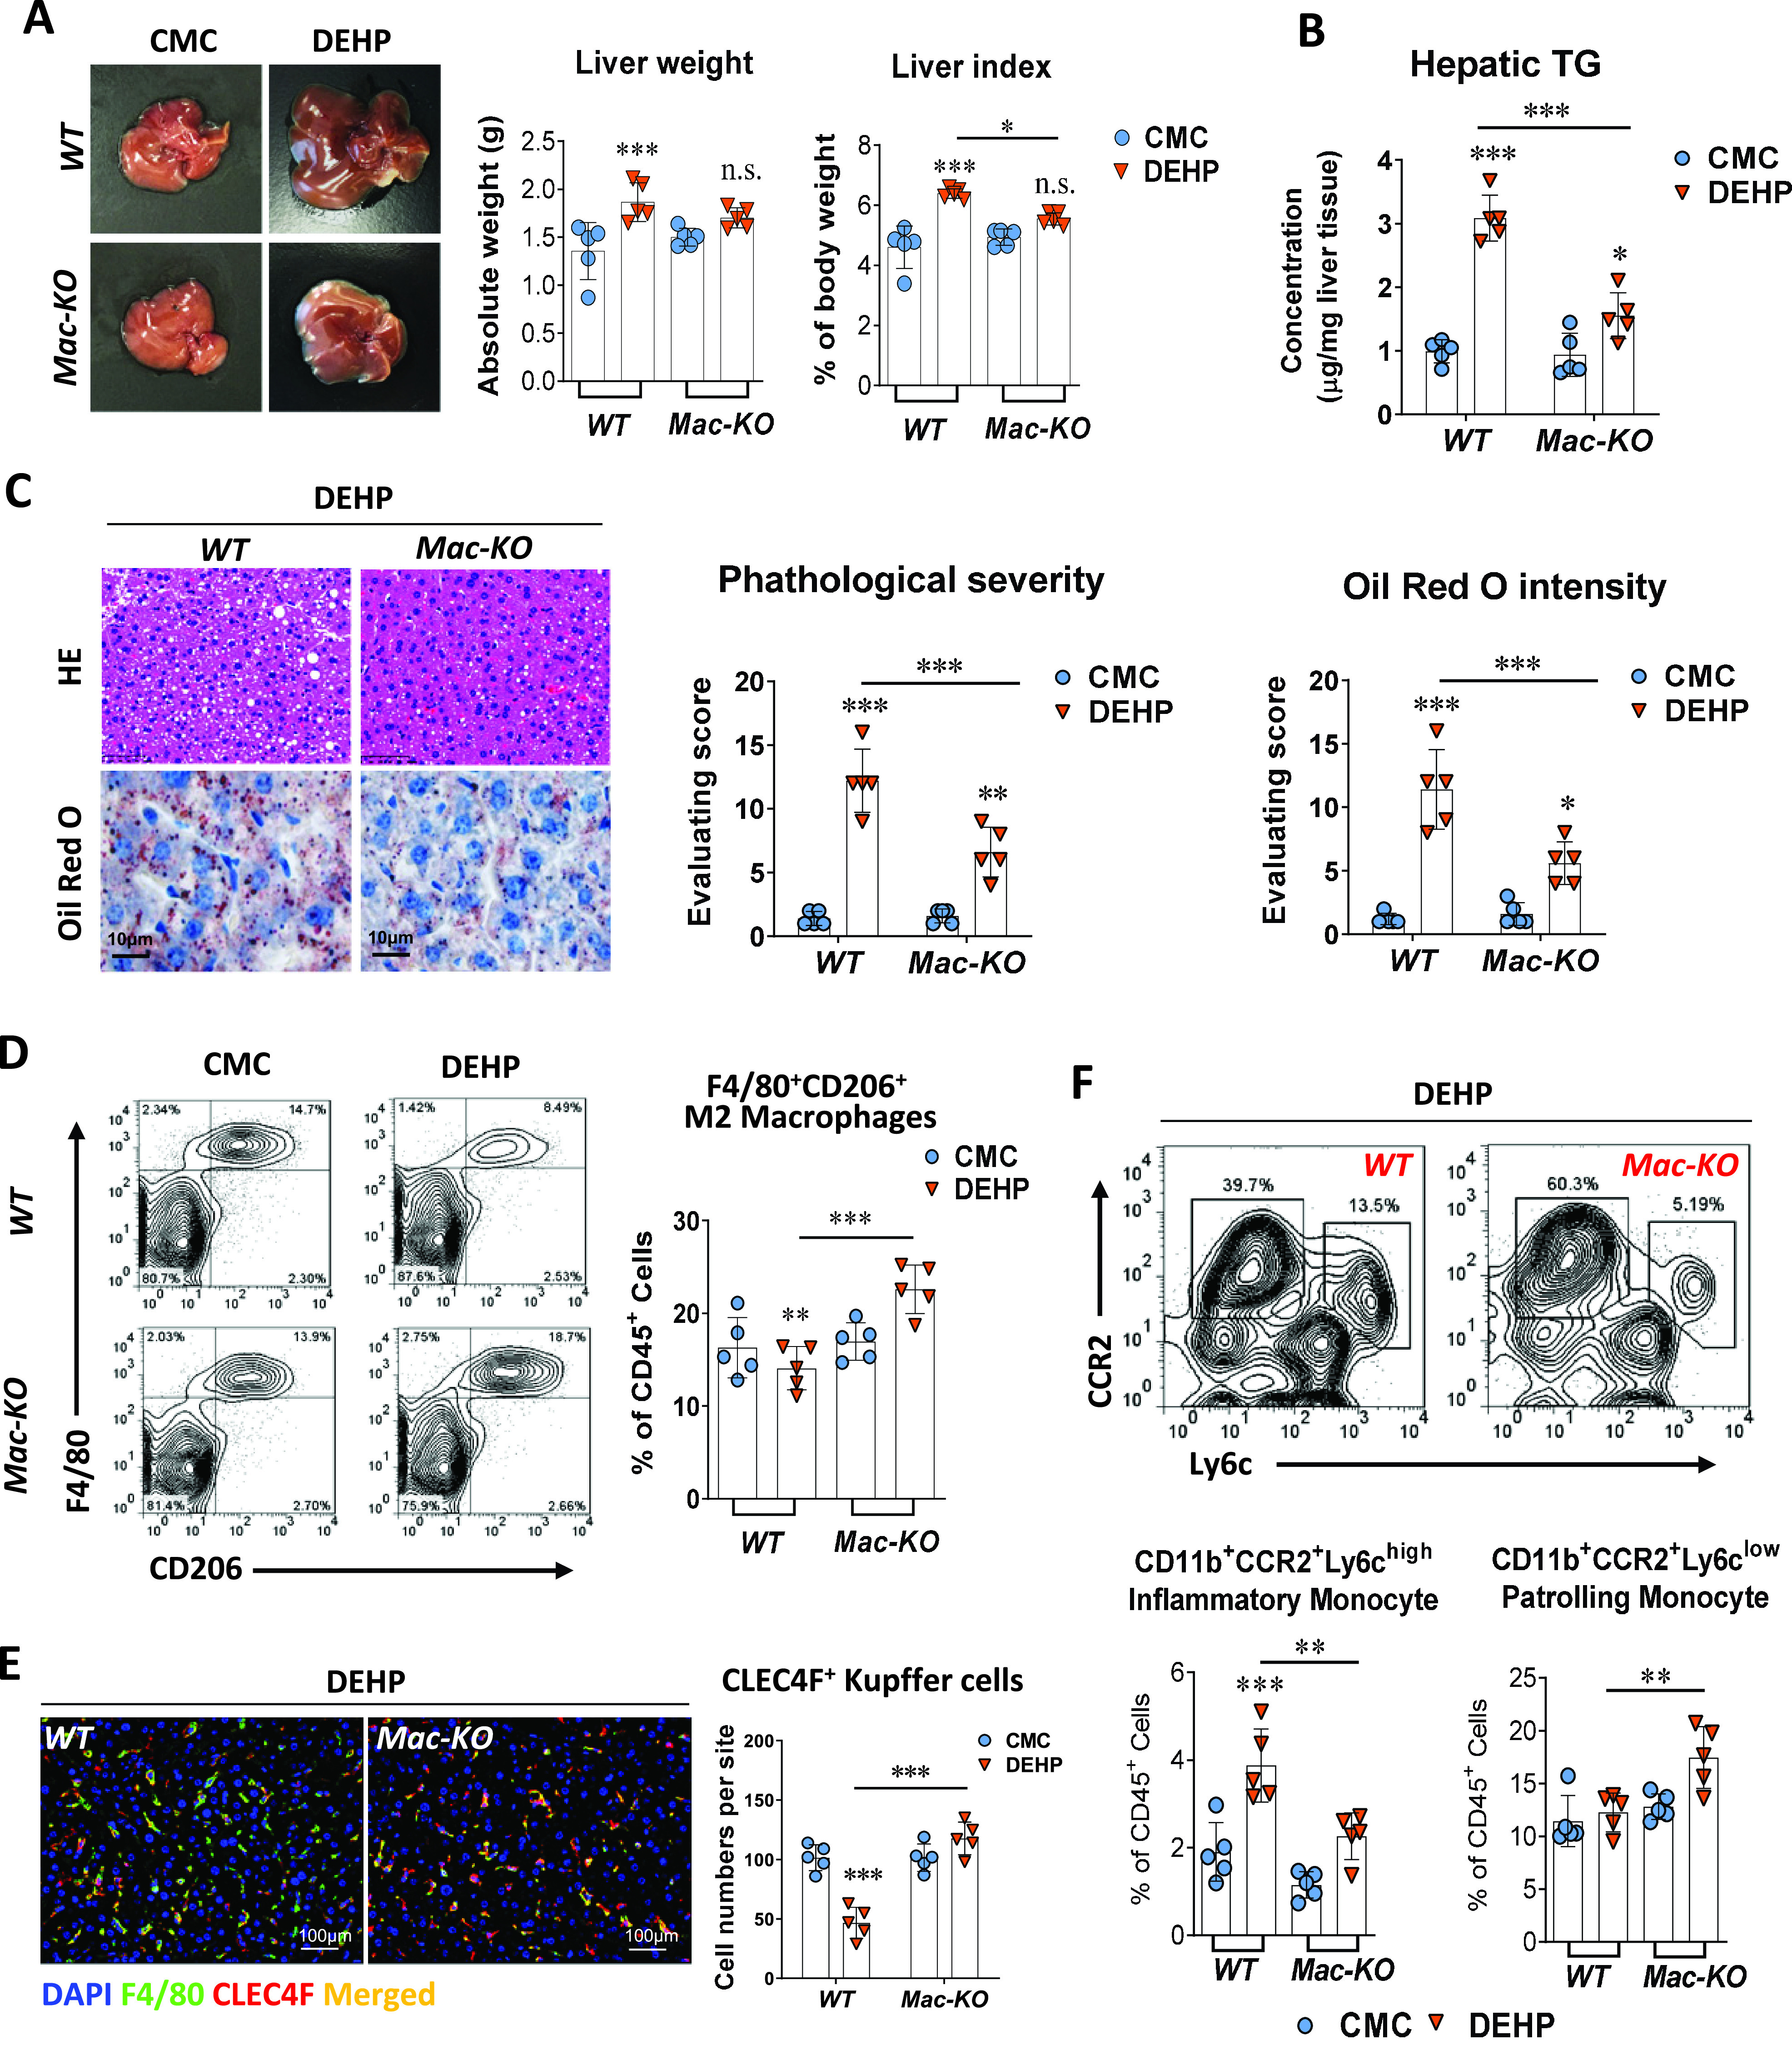
Figure 4A is one set of images and two bar graphs. The image of mice livers displays two columns, namely, carboxymethylcellulose and diethylhexyl phthalate and two rows, namely, Wild type and Mac-K O. The two bar graphs titled Liver weight and Liver index, plotting Absolute weight (grams), ranging from 0.0 to 2.5 in increments of 0.5 and percentage of body weight, ranging from 0 to 8 in increments of 2 (y-axis) across Wild type and Mac-K O (x-axis) for carboxymethylcellulose and diethylhexyl phthalate, respectively. Figure 4B is a bar graph titled hepatic triglyceride, plotting concentration (micrograms per milligram liver tissue), ranging from 0 to 4 in unit increments (y-axis) across Wild type and Mac-K O (x-axis) for carboxymethylcellulose and diethylhexyl phthalate. Figure 4C is one set of stained tissues and two bar graphs. The stained tissue of mouse liver displays two columns, namely, Wild type and Mac-K O for diethylhexyl phthalate and two rows, namely, hematoxylin and eosin and Oil Red O with a scale bar of 10 micrometers. The two bar graphs titled Pathological severity and Oil Red O intensity, plotting evaluating score, ranging from 0 to 20 in increments of 5 across Wild type and Mac-K O (x-axis) for carboxymethylcellulose and diethylhexyl phthalate, respectively. Figure 4D is a set of flow cytometry gating graphs and one bar graph. The flow cytometry gating graphs, plotting Mac-K O and Wild type F 4 per 80 (y-axis) across C D 206 (x-axis) for carboxymethylcellulose and diethylhexyl phthalate. The bar graph plotting, percentage of C D 45 begin superscript positive end superscript cells, ranging from 0 to 30 in increments of 10 (y-axis) across Wild type and Mac-K O (x-axis) for carboxymethylcellulose and diethylhexyl phthalate. Figure 4E is one set of stained tissues and one bar graph. The stained tissue displays two columns, namely, Wild type and Mac-K O for diethylhexyl phthalate depicting D A P I, F 4 by 80, C L E C 4 F, and Merged with a scale bar of 100 micrometers. The bar graph titled C L E C 4 F begin superscript positive end superscript Kupffer cells, plotting cell numbers per site, ranging from 0 to 200 in increments of 50 across Wild type and Mac-K O (x-axis) for carboxymethylcellulose and diethylhexyl phthalate. Figure 4F is a set of one flow cytometry gating graphs and two bar graphs. The flow cytometry gating graphs are titled diethylhexyl phthalate, plotting C C R 2 (y-axis) across L y 6 C (x-axis) for Wild type and Mac-K O. The two bar graphs titled C D 11 b begin superscript positive end superscript C C R 2 begin superscript positive end superscript L y 6 c begin superscript high end superscript inflammatory monocyte and C D 11 b begin superscript positive end superscript C C R 2 begin superscript positive end superscript L y 6 c begin superscript low end superscript patrolling monocyte, plotting percentage of C D 45 begin superscript positive end superscript cells, ranging from 0 to 6 in increments of 2 and 0 to 25 in increments of 5 (y-axis) across Wild type and Mac-K O (x-axis) for carboxymethylcellulose and diethylhexyl phthalate, respectively.

Effect of macrophage-specific PPARγ knockout in DEHP-induced fatty liver. Wild-type (WT, n=5/group) and macrophage-specific PPARγ knockout (Mac-KO, n=5/group) C57BL/6J male mice were treated with 0.5% (wt/vol) sodium carboxymethylcellulose (CMC; vehicle control) or DEHP (625mg/kg BW) by daily gavage for 28 d. (A) Representative image of mice livers and quantification of liver weight and liver index at the end of the treatment (n=5/group). The data are provided in Table S19. (B) Hepatic TG concentration in the liver tissue of WT (n=5/group) and Mac-KO (n=5/group) mice at the end of the treatment. The data are provided in Table S20. (C) Representative images of histology and Oil Red O staining of mouse liver at the end of the treatment (left). Hepatic steatosis and lipid accumulation were quantified by calculating the score of pathological severity and Oil Red O staining intensity, respectively (right, n=5/group). The data are provided in Table S21. (D) Representative flow cytometry gating graph and quantification of hepatic M2 macrophages (F4/80+CD206+) in the WT or Mac-KO (n=5/group) mice at the end of the treatment. The data are provided in Table S22. (E) Immunofluorescence staining of CLEC4F (red) and F4/80 (green) in the mouse liver of WT or Mac-KO mice (n=5/group) at the end of the treatment. Cells with positive stain of CLEC4F in the liver sections of WT and Mac-KO mice (n=5/group) were quantified using the ImageXpress system under 20×magnification. The data are provided in Table S23. (F) Representative flow cytometry gating graph and quantification of inflammatory monocyte (CD11b+CCR2+Ly6chigh) and patrolling monocyte (CD11b+CCR2+Ly6chigh) in the liver of WT or Mac-KO mice (n=5/group) at the end of the treatment. The data are provided in Table S24. All data are expressed as mean+SD. The data were analyzed using two-way ANOVA followed by Tukey’s multiple comparisons test. *p<0.05, **p<0.01, ***p<0.001 compared with the vehicle control (i.e., CMC); significance of comparison between WT and Mac-KO groups of DEHP treatment was labeled above lines. Note: ANOVA, analysis of variance; BW, body weight; DAPI, 4′,6-diamidino-2-phenylindole; DEHP, diethylhexyl phthalate; HE, hematoxylin and eosin; SD, standard deviation; TG, triglyceride.