. 2022 Jan 12;130(1):017005. doi: 10.1289/EHP9373

Figure 6.

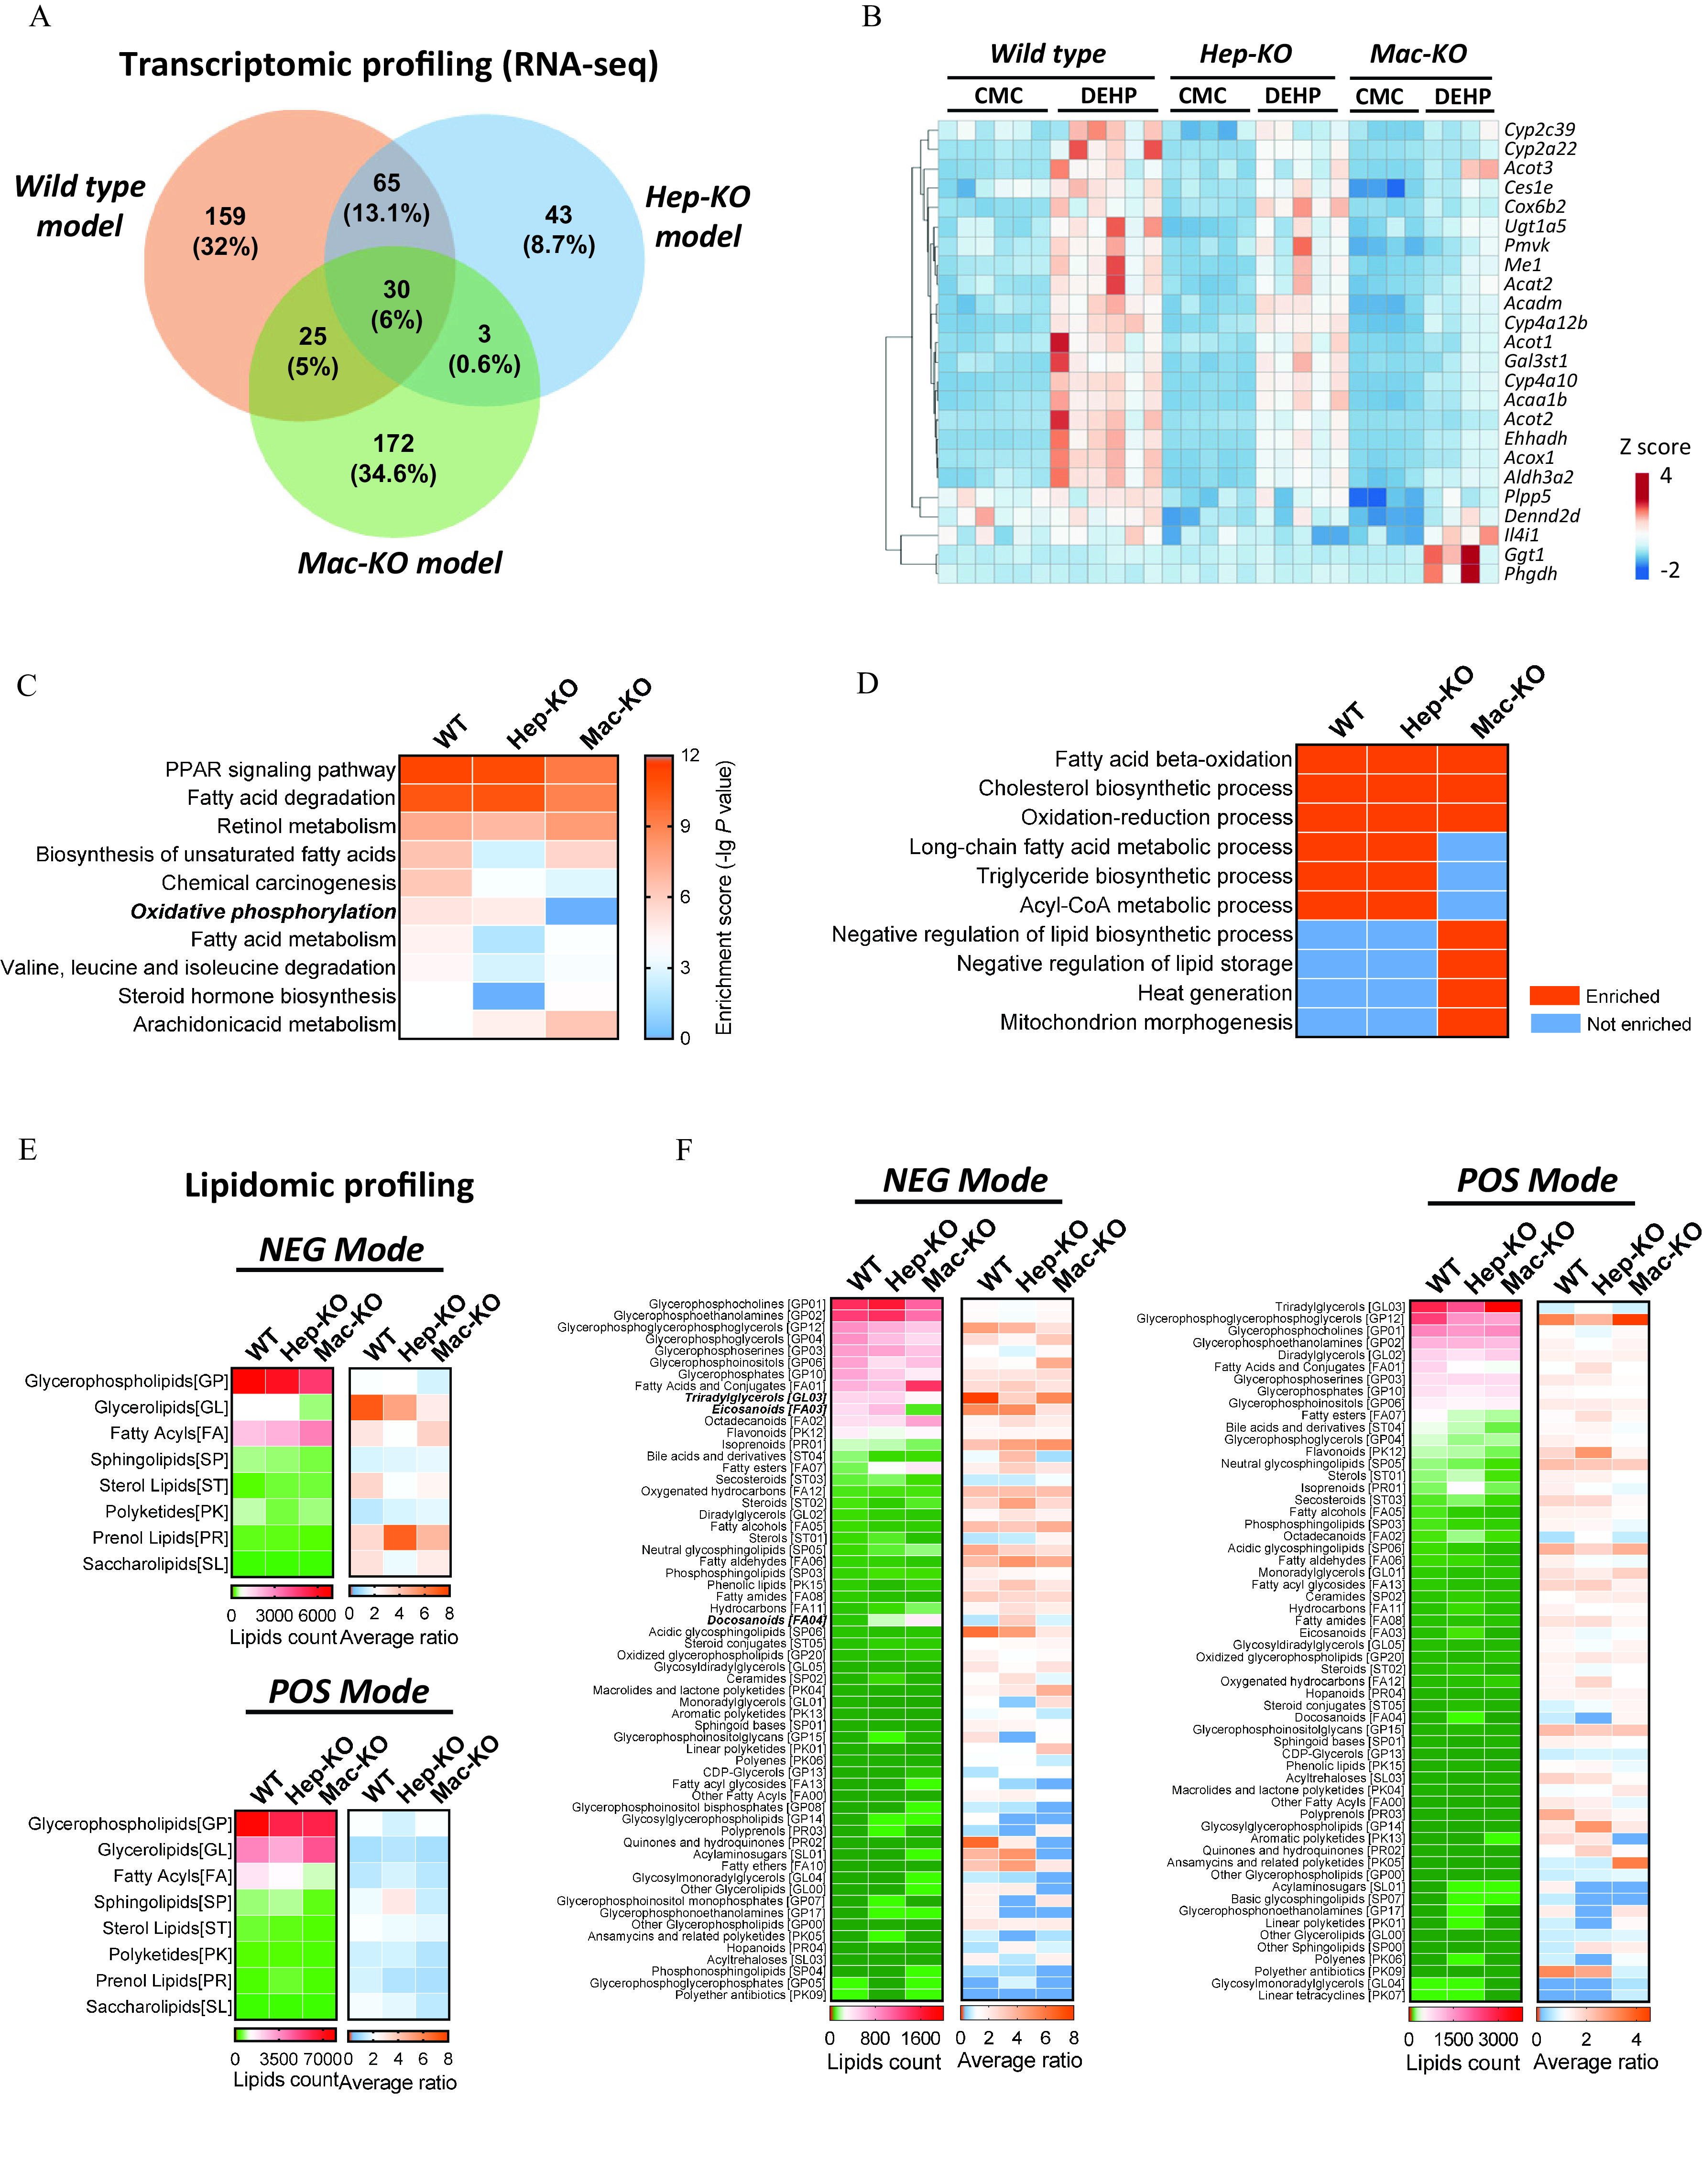
Figure 6A is a Venn diagram titled Transcriptomic profiling (R N A-seq) displays three circles. The circle on the left is labeled Wild type model, the circle on the right is labeled Hep-K O model, and the circle on the bottom is labeled Mac-K O model. The Wild type model depicts 159 (32 percent) profiling. The Hep-K O model depicts 43 (8.7 percent) profiling. The Mac-K O model depicts 172 (34.6 percent) profiling. The Wild type model and Hep-K O model intersection depicts 65 (13.1 percent) profiling. The Hep-K O model and Mac-K O model intersection depicts 3 (0.6 percent) profiling. The Mac-K O model and Wild type model intersection depicts 25 (5 percent) profiling. The combined intersection area depicts 30 (6 percent) profiling. Figure 6B is a heatmap, plotting Wild type, Hep-K O, and Mac-K O each include carboxymethylcellulose and diethylhexyl phthalate (columns) across Cyp 2c 39, Cyp 2 a 22, Acot 3, Ces 1 e, Cox 6 b 2, Ugt 1 a 5, Pmvk, Me 1, Acat 2, Acadm, Cyp 4 a 12 b, Acot 1, Ga l3 st 1, Cyp 4 a 10, Acaa 1 b, Acot 2, Ehhadh, Acox 1, Aldh 3 a 2, Plpp 5, Dennd 2 d, Il 4 i1, Ggt 1, and Phgdh (rows). A color scale depicting uppercase Z score is ranging from negative 2 to 4 in increments of 2. Figure 6C is a heatmap, plotting Wild type, Hep-K O, and Mac-K O (columns) across peroxisome proliferator-activated receptor signaling pathway, Fatty acid degradation, Retinol metabolism, Biosynthesis of unsaturated fatty acids, Chemical carcinogenesis, Oxidative phosphorylation, Fatty acid metabolism, Valine, leucine and isoleucine degradation, Steroid hormone biosynthesis, and Arachidonicacid metabolism (rows). A color scale depicting Enrichment score (negative log of uppercase p value) is ranging from 0 to 12 in increments of 3. Figure 6D is a heatmap, plotting Wild type, Hep-K O, and Mac-K O (columns) across Fatty acid beta-oxidation, Cholesterol biosynthetic process, Oxidation-reduction process, Long-chain fatty acid metabolic process, Triglyceride biosynthetic process, Acyl-CoA metabolic process, Negative regulation of lipid biosynthetic process, Negative regulation of lipid storage, Heat generation, and Mitochondrion morphogenesis (rows) for Enriched and Not enriched. Figure 6E is a set of four heatmaps titled Lipidomic profiling. The first two heatmaps are titled N E G Mode and the last two heatmaps are titled P O S mode, plotting Wild type, Hep-K O, and Mac-K O (columns) across Glycerophospholipids (G P), Glycerolipids (G L), Fatty acyls (F A), Sphingolipids (S P), Sterol Lipids (S T), Polyketides (P K), Prenol lipids (P R), and Saccharolipids (S L) (rows). A color scale depicting lipid counts is ranging from 0 to 6,000 in increments of 3,000 and 0 to 7,000 in increments of 3,500. A color scale depicting average ratio is ranging from 0 to 8 in increments of 2, respectively. Figure 6F is a set of four heatmaps. The first two heatmaps are titled N E G Mode, plotting Wild type, Hep-K O, and Mac-K O (columns) across Glycerophosphocholines (G P 01), Glycerophosphoethaolamines (G P 02), Glycerophosphoglycerophosphoglycerols (G P 12), Glycerophosphoglycerols (G P 04), Glycerophosphoserines (G P 03), Glycerophosphoinositols (G P 06), Glycerophosphates (G P 10), Fatty acids and conjugates (F A 01), Triradylglycerols (G L 03), Eicosanoids (F A 03), Octadecaniods (F A 02), Flavonoids (P K 12), Isoprenoids (P R 01), Bile acids and derivatives (S T 04), Fatty esters (F A 07), Secosteroids (S T 03), Oxygenated hydrocarbons (F A 12), Steriods (S T 02), Diradylglycerols (G L 02), Fatty alcohols (F A 05), Sterols (S T 01), Neutral glycosphingolipids (S P 05), Fatty aldehydes (F A 06), Phosphosphingolipids (S P 03), Phenolic lipids (P K 15), Fatty amides (F A 08), Hydrocarbons (F A 11), Docosanoids (F A 04), Acidic glycosphingolipids (S P 06), Steroid conjugates (S T 05), Oxidized glycerophospholipids (G P 20), Glycosyldiradylglycerois (G L 05), Ceramides (S P 02), Macrolides and lactone polyketides (P K 04), Monoradylglycerols (G L 01), aromatic polyketides (P K 13), Sphingoid bases (S P 01), Glycerophosphoinositolglycans (G P 15), Linear polyketides (P K 01), polyenes (P K 06), C D P-glycerols (G P 13), Fatty acyl glycosides (F A 13), other fatty acids (F A 00), Glycerophosphoinositol bisphosphates (G P 08), Glycosylglycerophospholipids (G P 14), polyprenols (P R 03), Quinones and hydroquinones (P R 02), Acylaminosugars (S L 01), fatty ethers (F A 10), Glycosylmonoradylglycerols (G L 04), Other Glycerolipids (G L 00), Glycerophosphoinositol monophosphates (G P 07), glycerophosphonoethanolamines (G P 17), other Glycerophospholipids (G P 00), Ansamycins and related polyketides (P K 05), hopanoids (P R 04), acyltrehaloses (S L 03), phosphonosphingolipids (S P 04), glycerophosphoglycerophosphates (G P 05), and polyether antibiotics (P K 09) (rows). A color scale depicting lipid counts is ranging from 0 to 1,600 in increments of 800 and a color scale depicting average ratio is ranging from 0 to 8 in increments of 2. The last two heatmaps are titled P O S mode, Wild type, Hep-K O, and Mac-K O (columns) across Triradylglycerols (G L 03), Glycerophosphoglycerophosphoglycerols (G P 12), Glycerophosphocholines (G P 01), Glycerophosphoethaolamines (G P 02), Diradylglycerols (G L 02), Fatty acids and conjugates (F A 01), Glycerophosphoserines (G P 03), Glycerophosphates (G P 10), Glycerophosphoinositols (G P06), fatty esters (F A 07), bile acids and derivatives (S T 04), Glycerophosphoglycerols (G P 04), Flavonoids (P K 12), Neutral glycosphingolipids (S P 05), Sterols (S T 01), Isoprenoids (P R 01), Secosteriods (S T 03), fatty alcohols (F A 05), Phosphosphingolipids (S P 03), Octadecanoids (F A 02), Acidic glycosphingolipids (S P 06), Fatty aldehydes (F A 06), Monoradylglycerols (G L 01), fatty acids glycerols (F A 13), Ceramides (S P 02), Hydrocarbons (F A 11), Fatty amides (F A 08), Eicosanoids (F A 03), Glycosyldiradylglycerols (G L 05), Oxidized glycerophospholipids (G P 20), Steroids (S T 02), Oxygenated hydrocarbons (F A 12), Hopanoids (P R 04), Steroid conjugates S T 05), Docosanoids (F A 04), Glycerophosphoinositolglycans (G P 15), Sphingoid bases (S P 01), C D P-Glycerols (G P 13), Phenolic lipids (P K 15), Acyltrehaloses (S L 03), Macrolides and lactone polyketides (P K 04), Other fatty acyls (F A 00), Polyprenols (P R 03), Glycosylglycerophospholipids (G P 14), Aromatic polyketides (P K 13), Quinones and hydroquinones (P R 02), Ansamycins and related polyketides (P K 05), Other glycerophospholipids (G P 00), Acylaminosugars (S L 01), Basic glycosphingolipids (S P 07), Glycerophosphonoethanolamines (G P 17), Linear polyketides (P K 01), Other Glycerolipids (G L 00), Other Sphingolipids (S P 00), Polyenes (P K 06), Polyether antibiotics (P K09), Glycosylmonoradylglycerols (G L 04), and Linear tetracyclines (P K 07) (rows). A color scale depicting lipid counts is ranging from 0 to 3,000 in increments of 1,500 and a color scale depicting average ratio is ranging from 0 to 4 in increments of 2.

Transcriptomic and lipidomic analysis of DEHP-induced fatty liver. RNA sequencing was performed with the liver of wild-type (WT; n=6/group), hepatocyte-specific PPARγ knockout (Hep-KO; n=5/group), and macrophage-specific PPARγ knockout (Mac-KO; n=4/group) mice treated with 0.5% (wt/vol) sodium carboxymethylcellulose (CMC; vehicle control) or DEHP (625mg/kg BW) by daily gavage for 28 d. (A) Venn diagram of differently expressed genes (DEGs) between DEHP and control (CT) group in the mice models. The data are provided in Table S33. (B) Heatmap of DEGs induced by DEHP in the WT, Hep-KO, and Mac-KO mice models. The data are provided in Table S34. (C) Integrated comparison of pathway enrichment (top 10) across the WT, Hep-KO, and Mac-KO mice models. The data are provided in Table S35. (D) Integrated comparison of Gene Ontology (GO) Biological Process enrichment across the WT, Hep-KO, and Mac-KO mice models. The criteria for “enriched” item is p<0.05 and TOP 20. The data are provided in Table S36. (E) Integrated comparison of DEHP-induced lipidomic changes in the WT, Hep-KO, and Mac-KO mice models. Lipidomic profiling was conducted with the liver of WT (n=6/group), Hep-KO (n=5/group), and Mac-KO (n=4/group) mice in the negative ion (NEG) and positive ion (POS) mode. The heatmap shows lipid counts and average fold change (DEHP/CT ratio) of lipid metabolites at the “superclass” level. The data are provided in Table S37. (F) Integrated comparison of DEHP-induced lipidomic changes in the WT, Hep-KO, and Mac-KO mice models at the “class” level. The heatmap shows lipid counts and average fold change in DEHP group compared with the CT group. The data are provided in Table S38. Note: BW, body weight; DEHP, diethylhexyl phthalate; PPAR, peroxisome proliferator-activated receptor.