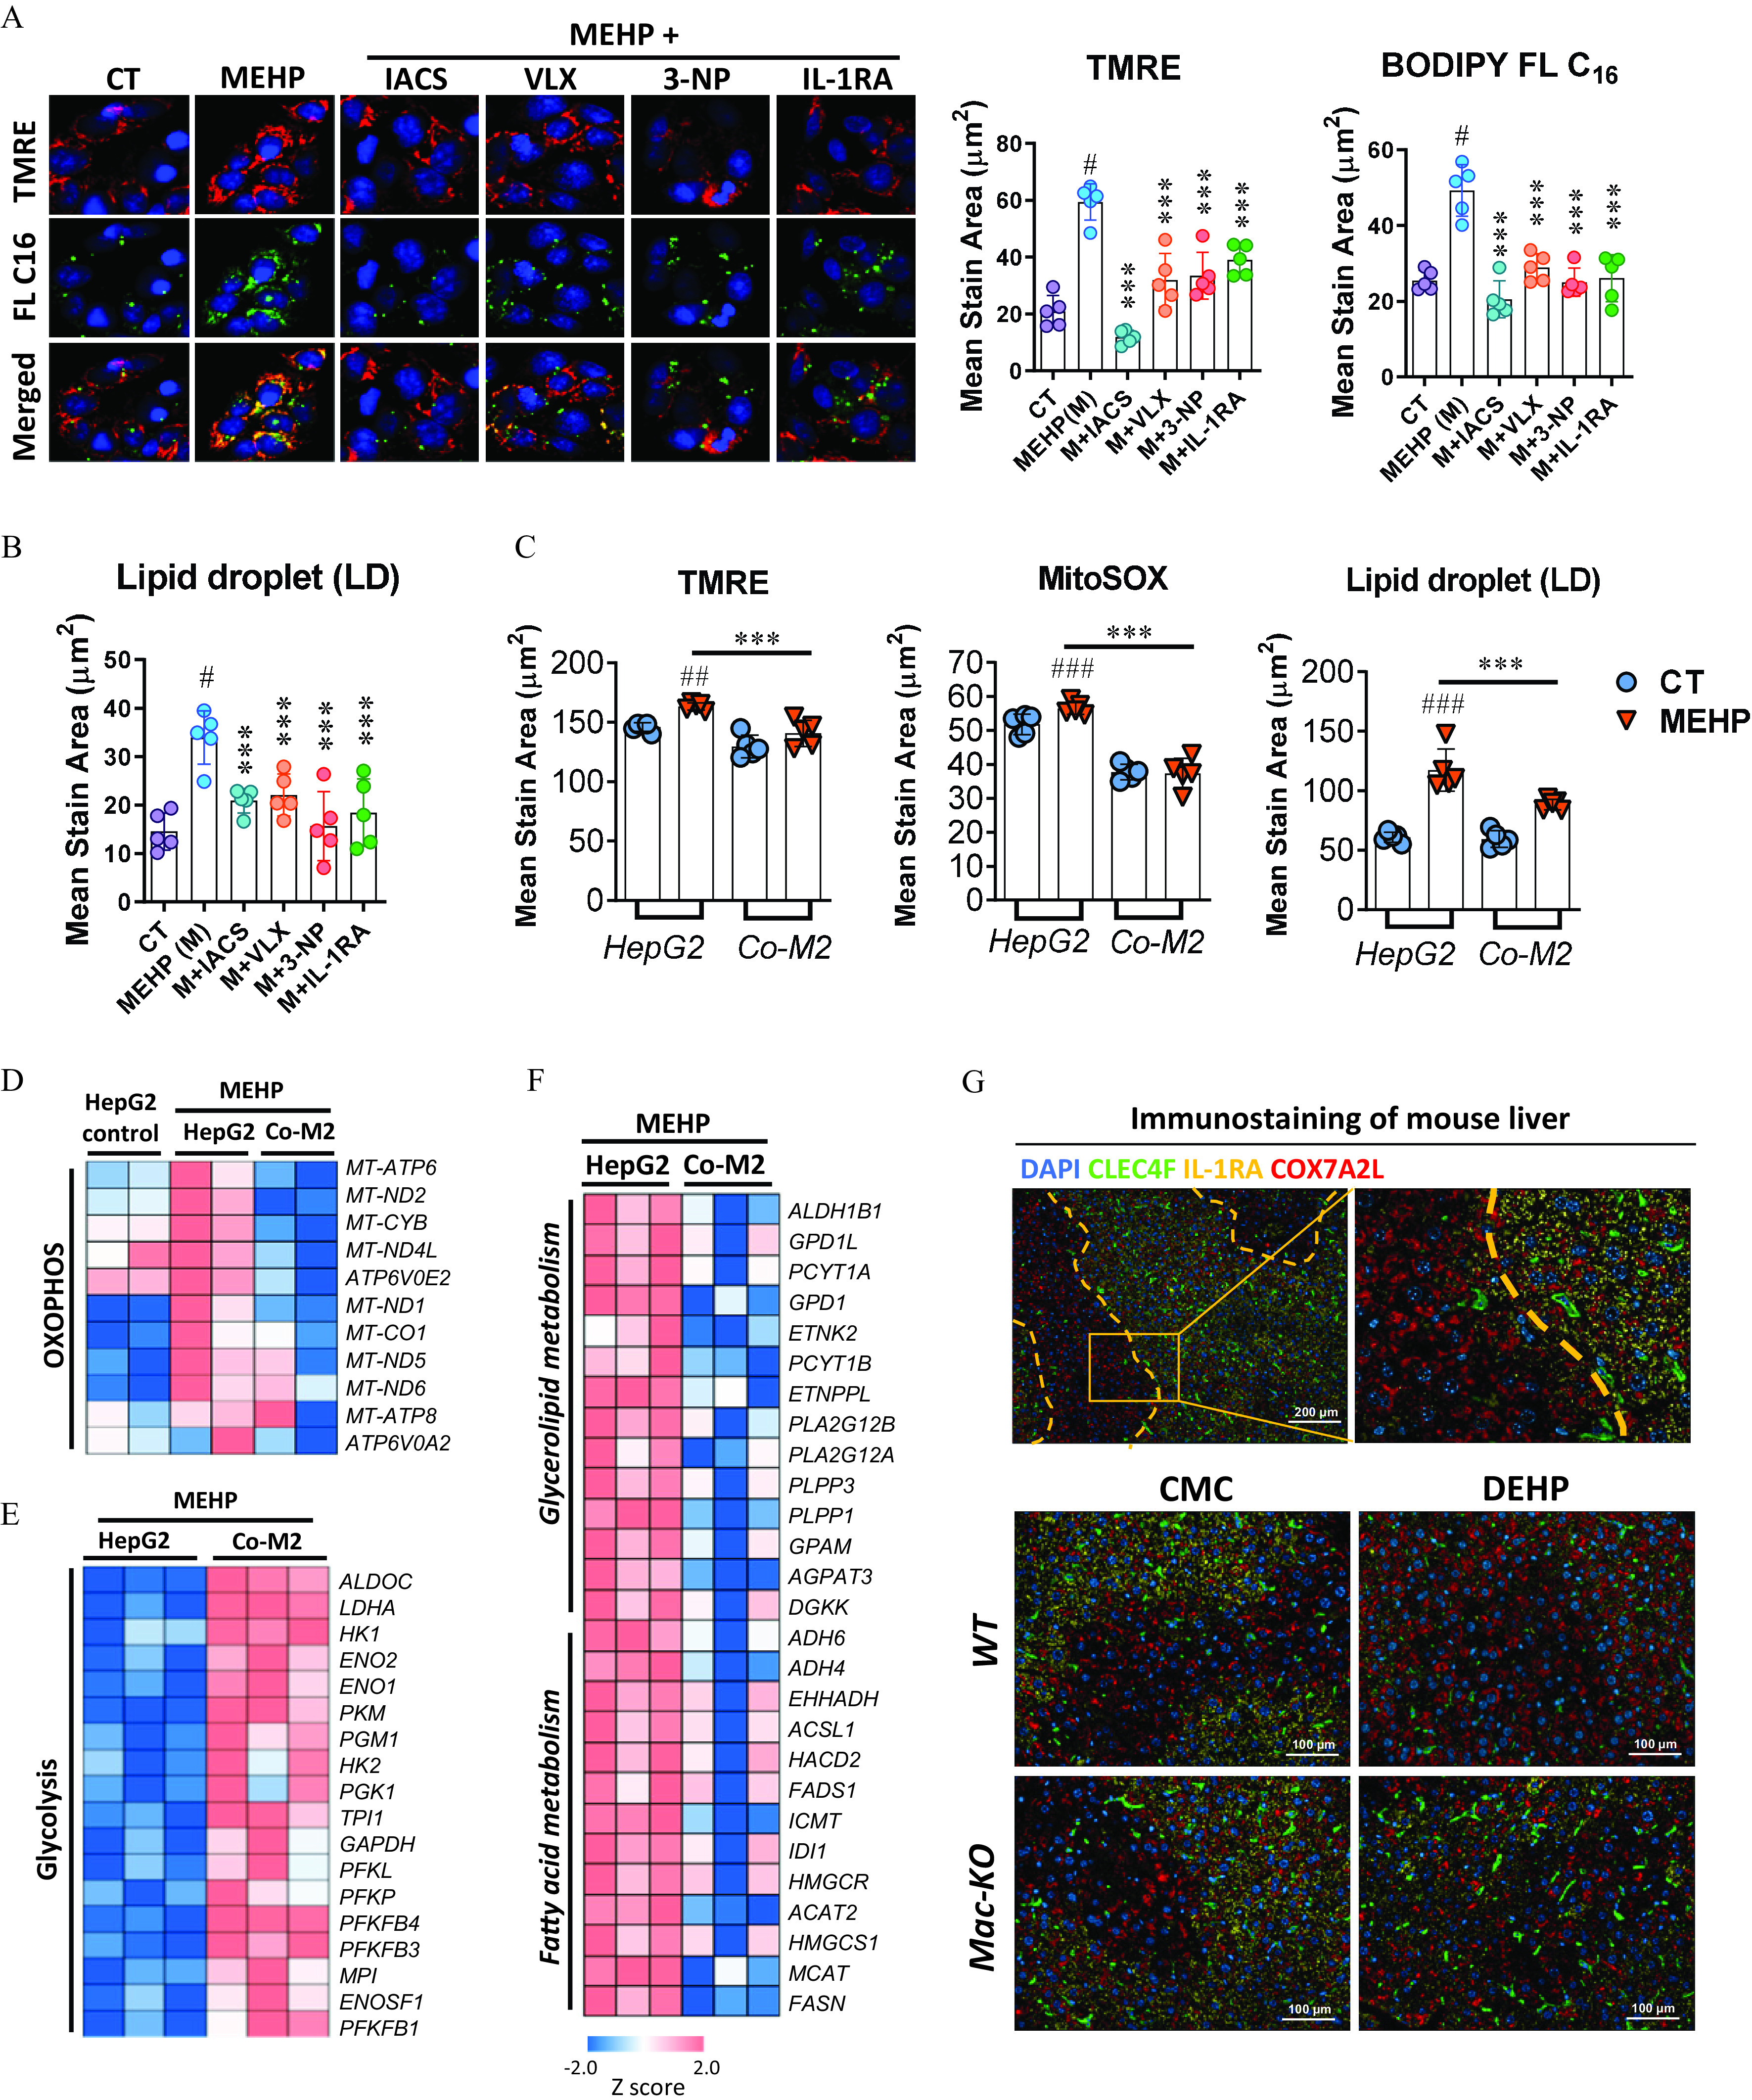
Figure 7.

Effect of M2 macrophages on OXPHOS and lipid metabolism in the hepatocytes. (A,B) HepG2 cells were treated with MEHP (M; ) alone or in combination with IACS-10759 (IACS; ), VLX600 (VLX; ), 3-nitropropanoic acid (3-NP; ), and IL-1RA () in replicate wells () for 24 h. Cells were incubated with the fluorescent dyes BODIPY FL and tetramethylrhodamine ethyl ester (TMRE), or LipidTOX Neutral Lipid Stain at the end of the treatment. (A) Representative images (left) and quantification (right) of lipid uptake (FL ) and mitochondrial membrane potential (TMRE) in HepG2 cells at the end of the treatment. (B) Quantification of lipid droplets (LDs) at the end of the treatment. The data for (A,B) are provided in Table S39. (C) Quantification of TMRE, Mitochondrial Superoxide (MitoSOX) and LD in the HepG2 cells treated with MEHP () alone or cocultured with M2 macrophages for 24h (). The data are provided in Table S40. HepG2 Cells in an independent experiment with the same treatment as (C) were used for RNA sequencing (). Heatmaps show differently expressed genes associated with (D) OXPHOS, (E) glycolysis, and (F) lipid metabolism between different treatments. The data for (D–F) are provided in Tables S41–S43. (G) Immunofluorescence staining of CLEC4F (green), IL-1RA (yellow), and COX7A2L (red) in the liver tissues of wild-type (WT) and macrophage-specific knockout (Mac-KO) mice treated with 0.5% (wt/vol) sodium carboxymethylcellulose (CMC; vehicle control) or DEHP ( BW) by daily gavage for 28 d. Data for (A–C) are expressed as . The data were analyzed using one-way (A,B) or two-way (C) ANOVA followed by Tukey’s multiple comparisons test. #, ##, ### compared with the vehicle control (CT); ***, compared with the MEHP group. Note: ANOVA, analysis of variance; BW, body weight; DAPI, 4′,6-diamidino-2-phenylindole; DEHP, diethylhexyl phthalate; IL, interleukin; MEHP, mono(2-ethylhexyl) phthalate; OXPHOS, oxidative phosphorylation; SD, standard deviation.
