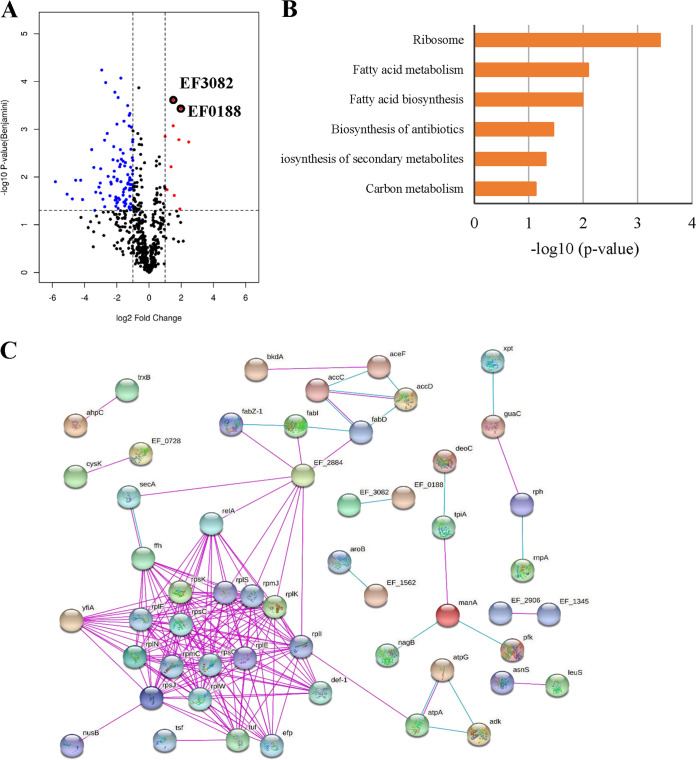
FIG 7.
Differential expression of proteins between the control groups and GA (15:1)-treated groups. (A) Volcano plots show log2 fold changes of protein levels after treatment of E. faecalis OG1RF cells with GA (15:1) (2 μg/mL, 1/2× MIC) compared to DMSO treatment. Blue dots represent proteins whose expression has been found to be inhibited by GA (15:1). Red dots represent proteins that are upregulated by GA (15:1). Black circles represent ABC transporters of iron. Data represent average values, and P values were calculated using a 2-sided 2-sample t test; n = 3 independent experiments per group. (B) KEGG Pathway terms of the differentially expressed proteins between the two groups. (C) Protein-protein interaction network analysis for proteins differentially expressed between the control groups and GA (15:1)-treated groups. Each node represents a protein, and each edge represents an interaction between proteins. Only known interactions were included. Disconnected nodes are hidden.

