FIG 2.
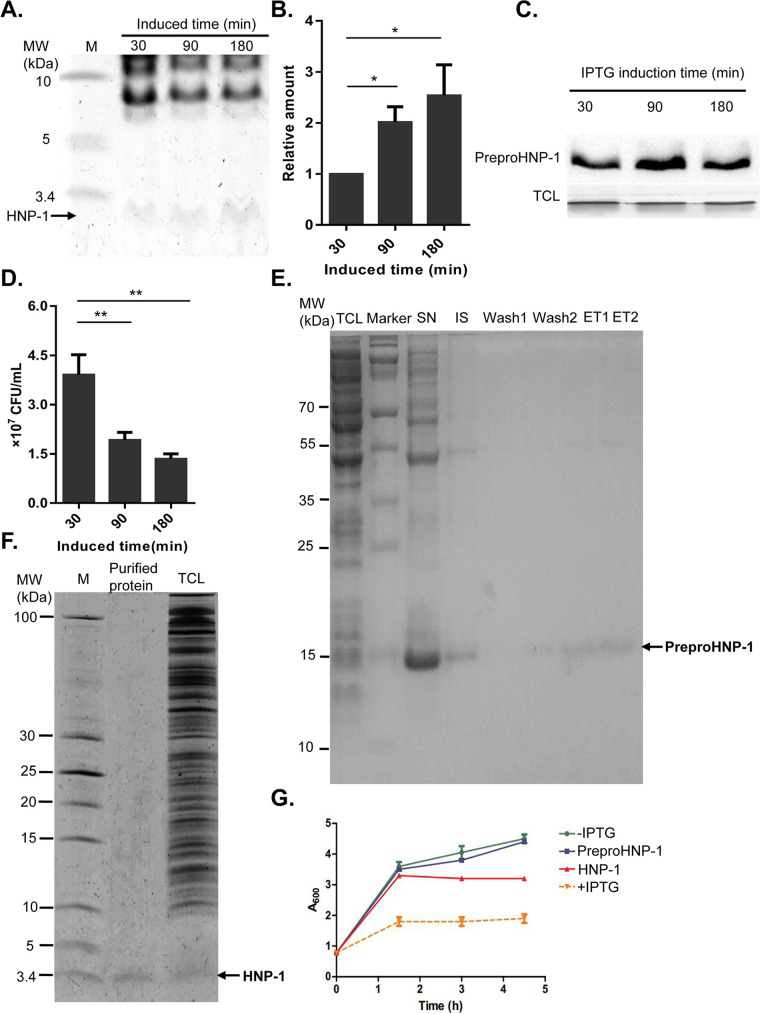
Increased antibacterial activity of the endogenous recombinant HNP-1. (A) The production of HNP-1 after IPTG induction. The induction time points of IPTG are labeled as indicated. (B) Quantitative analysis of the HNP-1 band in Fig. 2A by mass spectrometry. (C) The production of preproHNP-1 by IPTG induction analyzed by Western blot. The induction time points of IPTG are labeled as indicated. (D) Bacterial colony count after IPTG induction. The induction time points are labeled as indicated. The number of viable cells were counted after growing for 16 h on plates containing Luria-Bertani broth media. (E) PreproHNP-1 protein purification. TCL: total cell lysate; SN: supernatant; IS: insoluble protein; ET: elution. (F) Tris-Tricine gel analysis of the purified HNP-1. The TCL was saved as control. (G) Comparison of the antibacterial activity of the purified HNP-1. The growth curve of E. coli strain XPX-1 with 1 mM IPTG induction as a positive control and XPX-1 without IPTG induction as a negative control. PreproHNP-1 and HNP-1 represent treatment with the purified recombinant preproHNP-1 (20 μg/ml) and HNP-1 (20 μg/ml), respectively. Data were analyzed using a two-tailed Student's t test and are plotted as the mean ± SD for each condition. *, P < 0.05 and **, P < 0.01.

