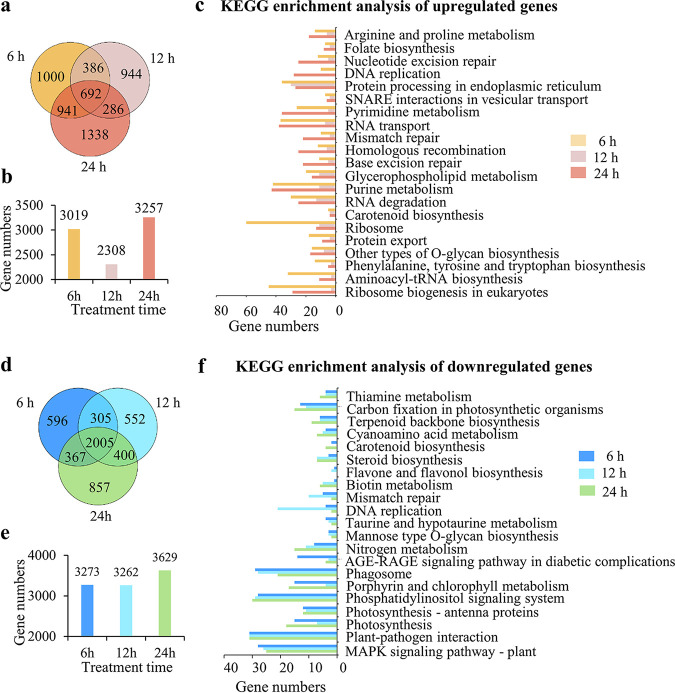
FIG 4.
Differentially expressed genes in P. globosa treated with 5% YX04 supernatant for different times. (a) Venn diagram of the upregulated genes after P. globosa treatment for different amounts of time. (b) Numbers of upregulated genes in P. globosa treatment for different amounts of time. (c) Enriched KEGG pathways of the upregulated genes. (d) Venn diagram of the downregulated genes. (e) Numbers of downregulated genes in P. globosa at different treatment time points. (f) Enriched KEGG pathways of the downregulated genes.

