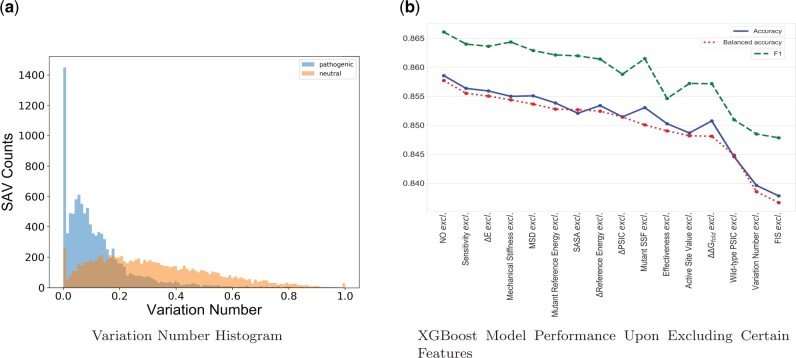
Fig. 1.
Feature validations. (a) A comparison of variation number histograms for the pathogenic and neutral SAVs. Among the 22 639 selected SAVs, 9743 SAVs were neutral and 10 564 SAVs were pathogenic. The mean variation number for the pathogenic SAVs was 0.12 while the mean variation number for the neutral SAVs was 0.32. (b) The XGBoost model was trained 15 times, each time excluding one feature from training. The results are shown with the accuracy, balanced accuracy and F1 scores calculated using the best model plotted on the y-axis

