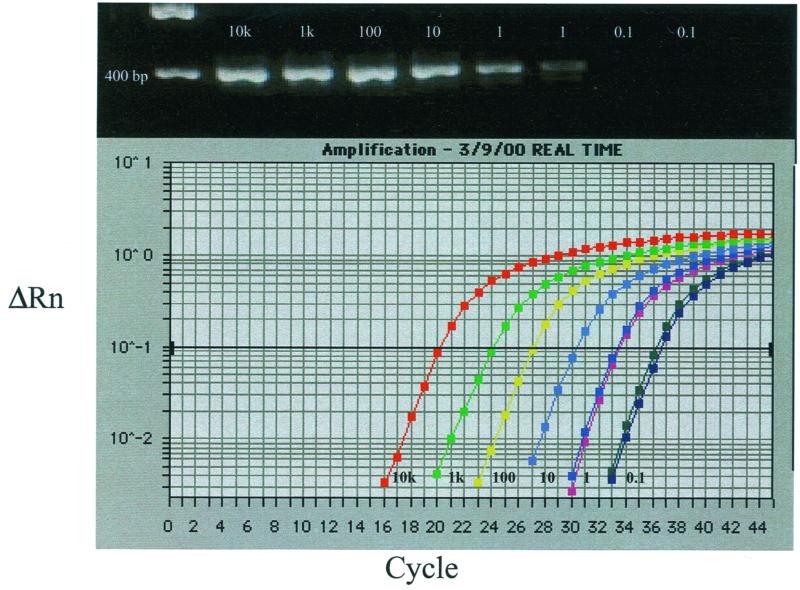
FIG. 1.
Sensitivity comparison of the TaqMan and RT-PCR assays for WN virus. The amplification plot was obtained from TaqMan assay testing of previously titrated WN virus dilutions (10,000 to 0.1 PFU; tests with 1 and 0.1 PFU were performed in duplicate) with the 3′NC primer-probe set. The inset in the upper portion depicts agarose gel electrophoresis of the RT-PCR products obtained from the same dilution series of WN virus with the 233-640c primer pair. ΔRn, change above threshold fluorescence.

