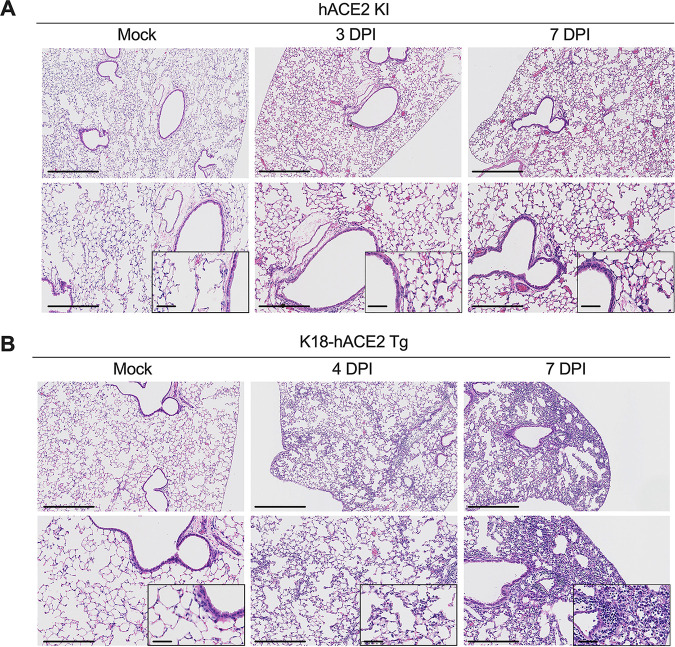
FIG 3.
Histopathological analysis of SARS-CoV-2 infection in hACE2 KI and K18-hACE2 mice. (A) Hematoxylin-and-eosin staining of lung sections from hACE2 KI mice following mock infection or after intranasal inoculation with 105 FFU of WA1/2020 at 3 and 7 dpi. (B) Hematoxylin-and-eosin staining of lung sections from K18-hACE2 mice following mock infection or after intranasal inoculation with 2.5 × 10⁴ PFU of SARS-CoV-2 WA1/2020 at 4 and 7 dpi. Images show low-power (top; bars, 500 μm), medium-power (bottom; bars, 250 μm), and high-power (insets in the bottom panels; bars, 100 μm) magnification. Images are representative of n = 4 per group.

