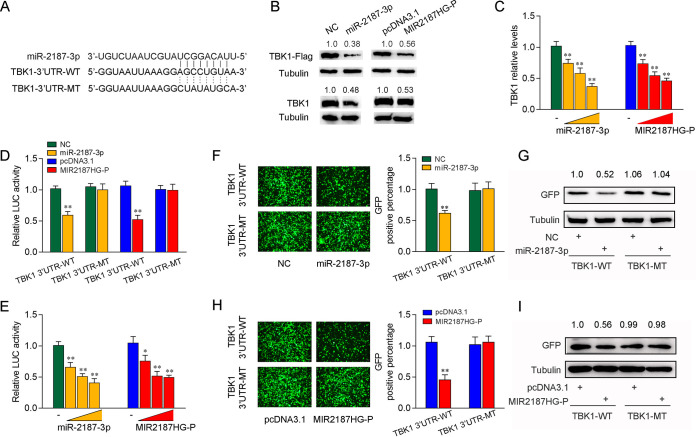
FIG 4.
miR-2187-3p targets the 3′ UTR of miiuy croaker TBK1. (A) Schematic diagram of the predicted target sites of miR-2187-3p in the 3′ UTR of TBK1. miR-2187-3p-binding sites in TBK1 wild-type form (TBK1 3′-UTR-WT) and the mutated form (TBK1 3′-UTR-MT) are shown. (B) miR-2187-3p regulates TBK1 expression. EPC cells were cotransfected with the IRAK4 expression plasmid with a Flag tag, along with miR-2187-3p or NC (top). After 48 h, TBK1 expression was determined by Western blotting. MICs were transfected with miR-2187-3p or NC (bottom). After 48 h, TBK1 expression was determined by Western blotting. (C) miR-2187-3p suppresses the mRNA expression of TBK1. MICs were cotransfected with miR-2187-3p, NC, MIR2187HG-P, or pcDNA3.1 At 48 h posttransfection, the expression of TBK1 was determined by qPCR. (D) miR-2187-3p targets the 3′ UTR of TBK1. EPC cells were transfected with NC, miR-2187-3p, pcDNA3.1, or MIR2187HG plasmid along with TBK1 3′-UTR-WT or TBK1 3′-UTR-MT for 24 h, and then the luciferase activity was determined. The luciferase activity was measured and normalized to Renilla luciferase activity. (E) The concentration gradient assay was performed with miR-2187-3p mimics and MIR2187HG-P plasmid. The miR-2187-3p (0, 25, 50, and 100 nM), NC (100,75, 50, and 0 nM), MIR2187HG-P (0, 50, 100, and 200 ng) or pcDNA3.1 (200, 150, 100, and 0 ng) were cotransfected with TBK1 3′-UTR-WT into EPC cells. After 48 h posttransfection, the luciferase activity was determined. Luciferase activity was normalized to Renilla luciferase activity. (F and G) miR-2187-3p could downregulate GFP expression. EPC cells were cotransfected with the wild type of mVenus-TBK1 or the mutated type, together with NC or miR-2187-3p. At 48 h posttransfection, the fluorescence intensity (F) and the GFP expression (G) were evaluated by a Varioskan Lux multifunctional microplate reader (Thermo Fisher Scientific) and Western blotting, respectively. Bar, 20 μm; original magnification, ×10. (H and I) Analysis of MIR2187HG negatively regulating GFP expression performed by fluorescence intensity (H) and protein detection (I). Data are averages from three independent experiments. **, P < 0.01, and *, P < 0.05 compared to results with the control.

