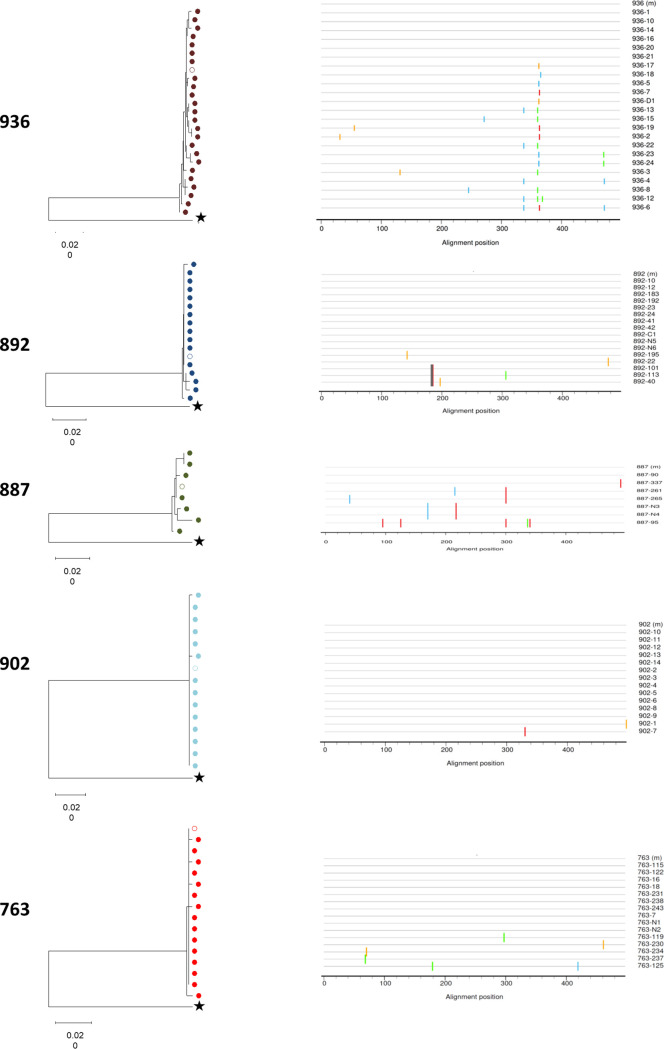
FIG 2.
Sequence phylogenetic analysis (C2-V5 region) of the virus circulating in plasma. (Left) Neighbor-joining (NJ) phylogenetic tree of the C2-V5 Env region was constructed with 81 sequences obtained from plasma viral RNA. Each patient is color-coded, and the empty circle represents the corresponding “master sequence.” Outgroup sequence (B.FR.83.HXB2 LAI IIIB BRU K03455) is represented by star. Branch lengths are presented as the number of substitutions per site. All patients’ sequences grouped with bootstrap values higher than 99%. (Right) Diagrammatic representations of the nucleotide differences between the master sequence and the sequences obtained by limit dilution (LD) from the five individuals. The master and LD sequences from each subject are represented by horizontal black lines. The horizontal axis indicates nucleotide positions in the C2-V5 region. Nucleotide differences between the master and LD sequences are indicated by ticks, with the color of the tick indicating the base present (A in green, C in blue, G in orange, and T in red). Mismatch analyses were performed using the highlighter tool, available at https://www.hiv.lanl.gov/content/sequence/HIGHLIGHT/highlighter_top.html.

