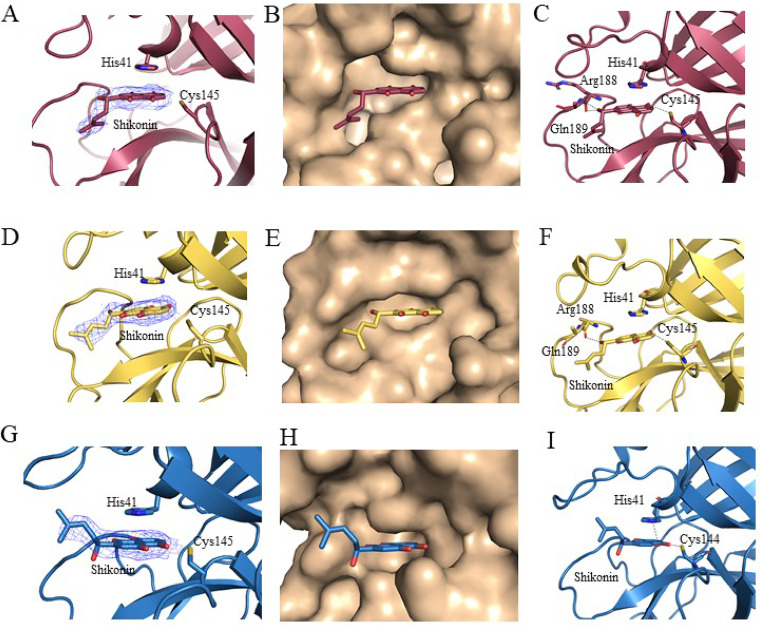
FIG 5.
Cocrystal structures of SARS-CoV-2 Mpro, SARS-CoV Mpro, and HCoV-NL63 Mpro in complex with shikonin. (A to C) SARS-CoV-2 Mpro-shikonin complex. (A) Fo_Fc omit map contoured at 0.5 σ for shikonin. (B) Shikonin (red) in the S1, S2, and S3 positions of the active site of SARS-CoV-2 Mpro. (C) Hydrogen bonding (dashed lines) interactions between SARS-CoV-2 Mpro and shikonin. (D to F) SARS-CoV Mpr o-shikonin complex. (D) Fo_Fc omit map contoured at 0.5 σ for shikonin. (E) Shikonin (yellow) in the S1, S2, and S3 positions of the active site of SARS-CoV Mpro. (F) Hydrogen bonding (dashed lines) interactions between SARS-CoV Mpro and shikonin. (G to I) HCoV-NL63 Mpro-shikonin complex. (G) Fo_Fc omit map contoured at 0.5 σ for shikonin. (H) Shikonin (blue) in the S1, S2, and S3 positions of the active site of HCoV-NL63 Mpro. (I) Hydrogen bonding (dashed lines) interactions between HCoV-NL63 Mpro and shikonin.

