FIGURE 5.

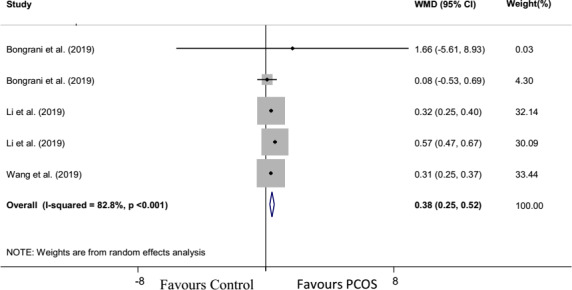
Forest plot detailing weighted mean differences (WMD) and 95% confidence intervals for the comparison of ovarian chemerin mRNA expression in PCOS with control group

Forest plot detailing weighted mean differences (WMD) and 95% confidence intervals for the comparison of ovarian chemerin mRNA expression in PCOS with control group