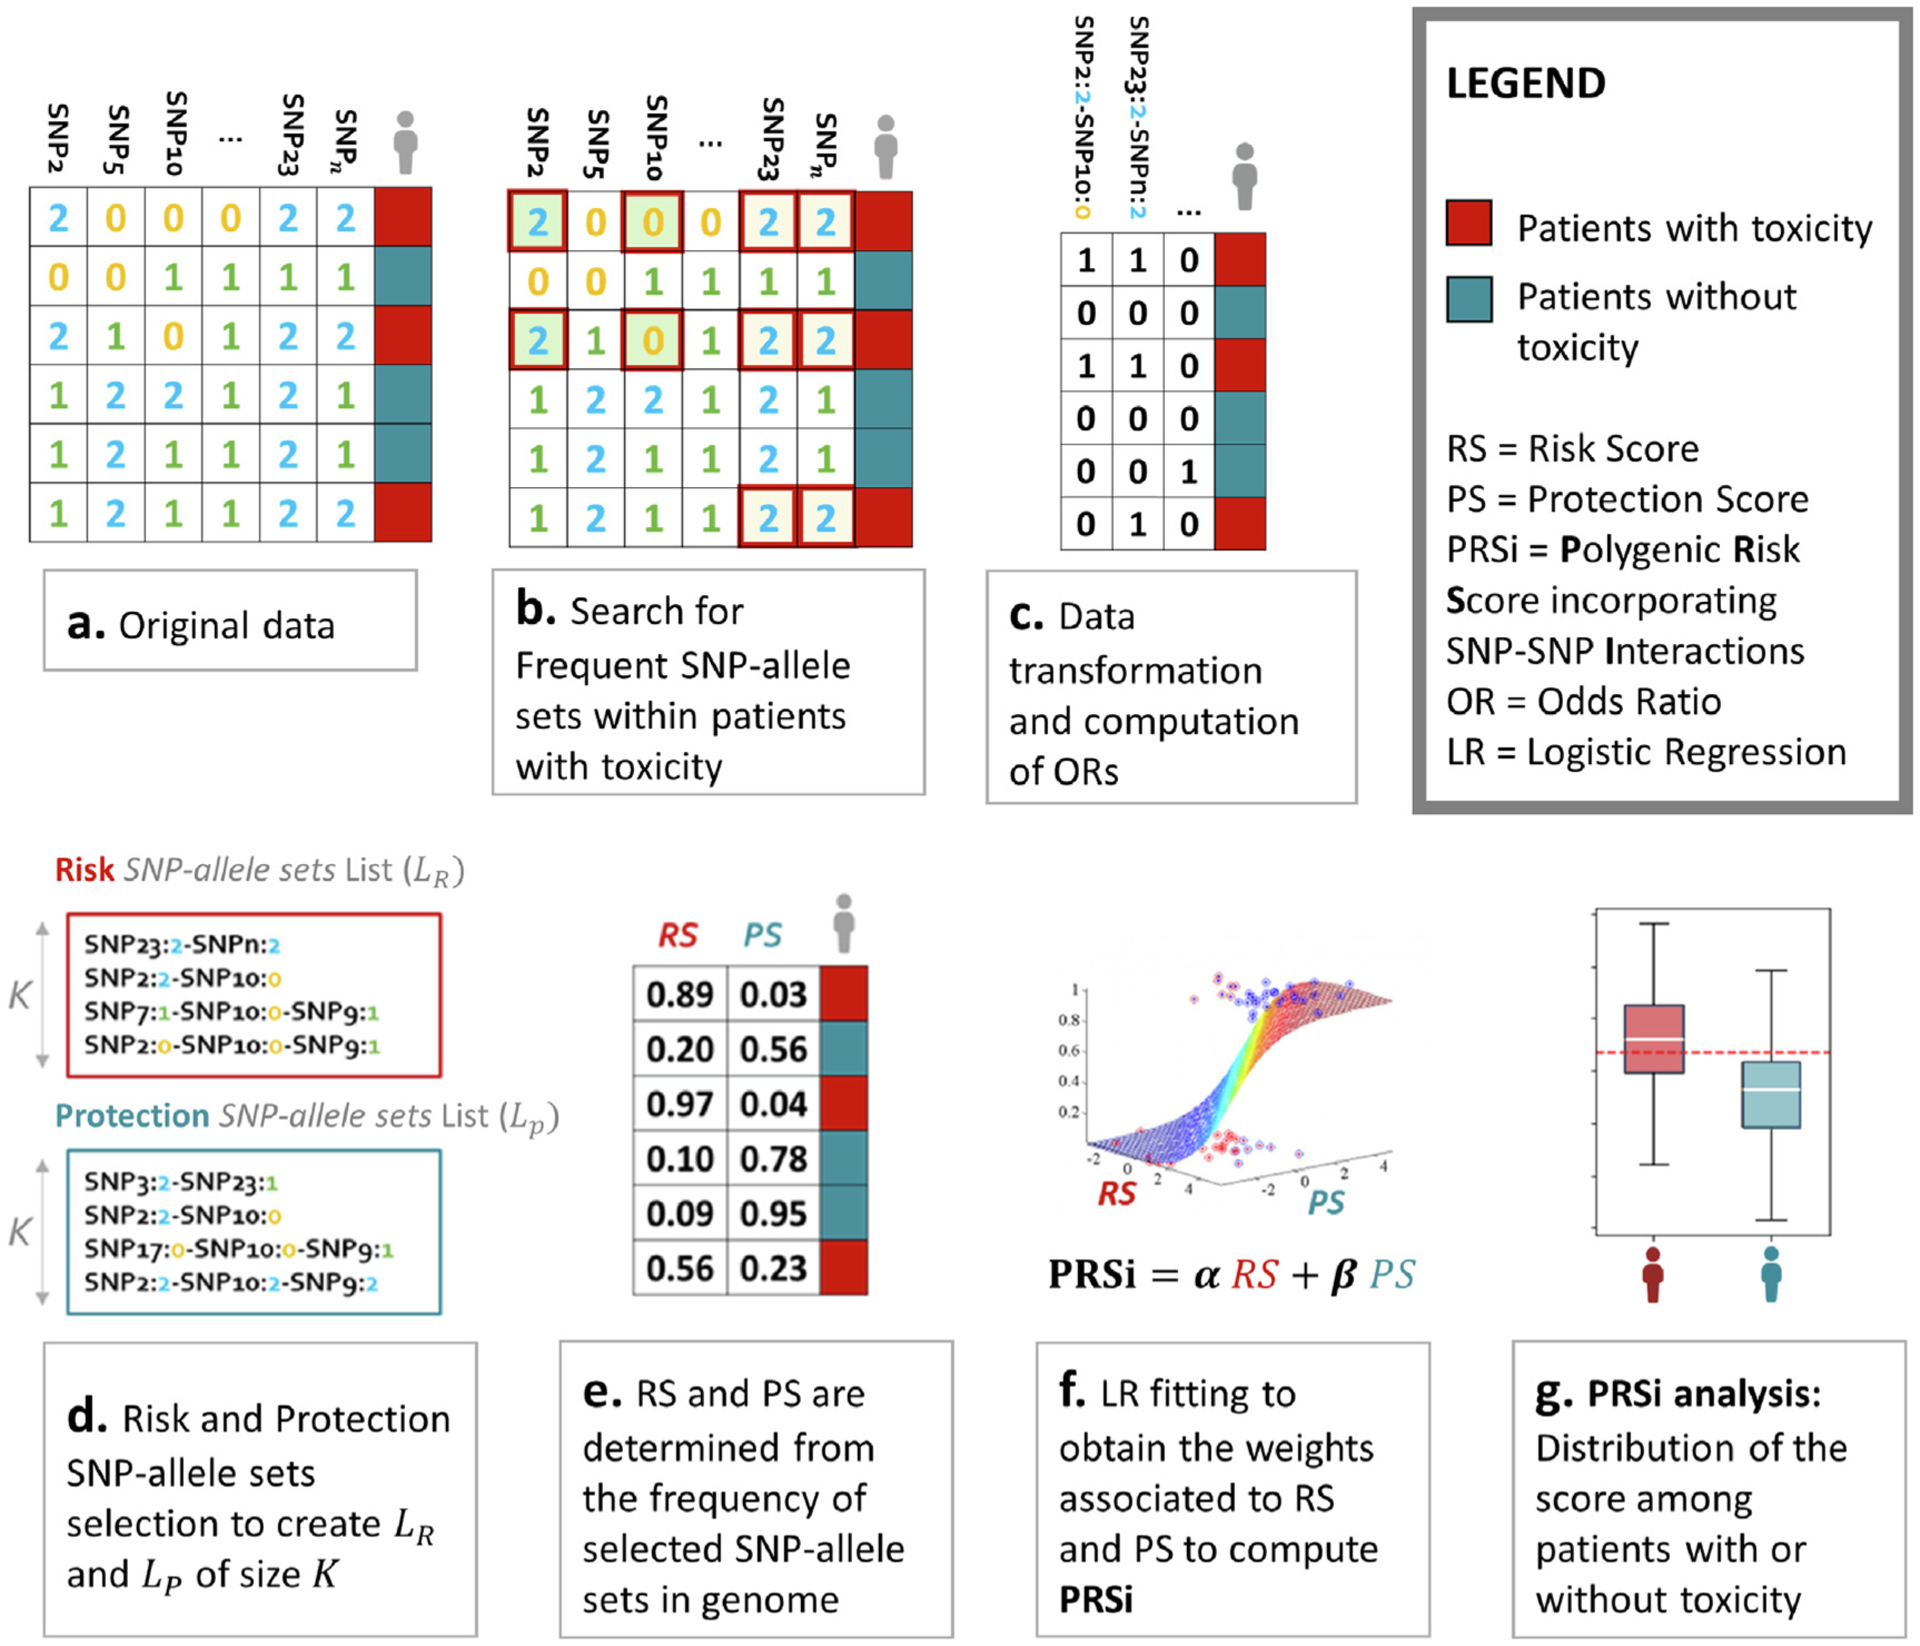
Fig. 1.

An illustration of the methodology used to generated polygenic risk scores incorporating SNP-SNP interactions (PRSi). (a) Data are available for multiple SNPs for patients identified as with (red) or without (blue) radiotherapy toxicity. (b) Our algorithm computes frequent (arbitrarily defined as seen in ≥ 10% of patients) SNP-SNP combinations, termed SNP-allele sets, associated with radiotherapy toxicity (i.e. the minority class). For example both the first and the third patient have a SNP2 value of 2 (i.e. homozygosity of the minor allele) and SNP10 value of 0 (i.e. homozygosity of the major allele). We call this SNP2 = 2, SNP10 = 0 combination a SNP-allele set. As a further example both the fifth and the sixth patient have SNP2 = 1, SNP5 = 2, SNP10 = 1 and SNP23 = 2: this is another SNP-allele set. (c) SNP-allele sets are transformed into patient-specific features, with a “1/yes” value if the patient harbours the considered SNP-allele set and a “0/no” value if the patient does not. Odds ratios are calculated for each SNP-allele set on the risk of toxicity. (d) Lists of risk SNP-allele sets associated with increased (risk) and decreased (protection) toxicity probability are generated. (e) Risk Score (RS) and Protection Score (PS) are calculated for each patient as the frequency in an individual’s genome of SNP-allele sets in the “Risk List” and in the “Protection List”, thus generating a table as in the Figure. Patients with toxicity should have RS near 1 and PS near 0, the converse for patients without toxicity. RS and PS data are fit to a logistic regression model to estimate weights for RS and PS for calculating the final PRSi. The distribution of PRSi should be different for patients with and without toxicity. The more separated the two distributions are, the better the PRSi is discriminating patients with toxicity.
