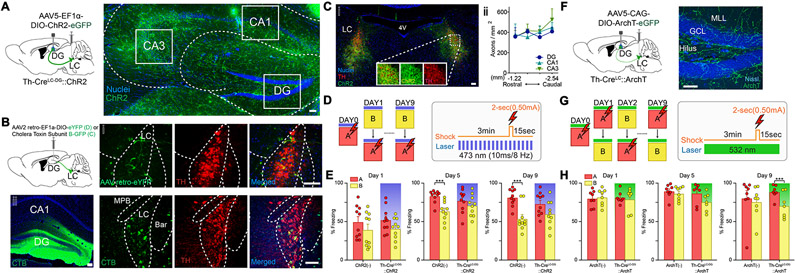
Fig. 1. Optogenetic manipulation of the LC-DG circuit in contextual fear discrimination.
(A) Schematic of experimental approach depicts infection of locus coeruleus-norepinephrine (LC-NE) cells using Th-Cre mouse line with channelrhodopsin (Th-CreLC-DG::ChR2). ChR2+ fibers indicate axons in the dorsal hippocampus originating from the TH+-LC cells. Scale bar = 50 μm. (B) Retrograde tracing from the DG using Retro-AAV (top) or Green-CTB (bottom). Arrows indicate cells projecting to the DG that coexpress with TH. Scale bars = 100 μm. (C) ChR2-expressing LC-NE cells coexpressed tyrosine hydroxylase (TH). Scale bar = 100 μm. The density of ChR2+ fibers in the DG in hippocampal subregions: dentate gyrus (DG), CA1, and CA3. (D) CFD task with optogenetic activation of the LC-DG projection. Animals received a shock in context A (red), but not in context B (yellow) for nine days (left). Pattern of laser stimulation and shock (only in context A) during CFD (right). (E) Acute activation of the LC-DG projection impairs behavioral pattern separation in mice expressing ChR2 in LC-DG projections (Th-CreLC-DG::ChR2, n = 10), but not in wild-type controls (ChR2(−), n = 10). ChR2(−) controls were able to discriminate on the fifth and ninth days of training, while Th-CreLC-DG::ChR2 could not discriminate on those days (ChR2(−): Day 1A: 49.8 ± 6.61; Day 1B: 39.6 ± 6.99; Day 5A: 83.2 ± 2.54; Day 5B: 63.7 ± 4.08; Day 9A: 81.6 ± 3.51; Day 9B: 53.9 ± 5.23; Th-CreLC-DG::ChR2: Day 1A: 52.4 ± 5.14; Day 1B: 40.8 ± 4.48; Day 5A: 77.2 ± 4.64; Day 5B: 70.9 ± 4.36; Day 9A: 73.2 ± 4.68; Day 9B: 59.8 ± 5.42; Two-way ANOVA for Th-CreLC-DG::ChR2 vs ChR2(−), A vs B: Day 1: Group: F(1,18) = 0.055, p = 0.818; Context: F(1,18) = 16.885, p < 0.001; Group × Context: F(1,18) = 0.076, p = 0.786; Day 5: Group: F(1,18) = 0.012, p = 0.913; Context: F(1,18) = 30.608, p < 0.001; Group × Context: F(1,18) = 8.034, p = 0.011; Day 9: Group: F(1,18) = 0.040, p = 0.843; Context: F(1,18) = 36.016, p < 0.001; Group × Context: F(1,18) = 4.463, p = 0.049). Both groups received optogenetic light during trial, shaded bar denotes successful stimulation of opsin. (F) Schematic of experimental approach depicts infection of LC-NE cells using Th-Cre mouse line with archaerhodopsin (Th-CreLC-DG::ArchT). Expression of ArchT in the DG regions (right). Scale bar = 50 μm. (G) CFD task with optogenetic inhibition of the LC-DG projection. Animals received a shock in context A (red), but not in context B (yellow) for nine days (left). Pattern of laser stimulation and shock (only in context A) during a CFD session (right). (H) Acute inhibition of LC-DG projection resulted in enhancement of behavioral pattern separation in mice expressing ArchT in LC-DG projections (Th-CreLC-DG::ArchT, n = 8), but not in wild-type controls (ArchT(−), n = 8). Th-CreLC-DG::ArchT animals were able to discriminate on the ninth day of training, while ArchT(−) controls could not discriminate on those days (ArchT(−): Day 1A: 80.3 ± 3.69; Day 1B: 81.7 ± 3.80; Day 5A: 89.7 ± 3.04; Day 5B: 86.4 ± 3.18; Day 9A: 80.6 ± 9.64; Day 9B: 75.6 ± 7.09; Th-CreLC-DG::ArchT: Day 1A: 81.4 ± 3.01; Day 1B: 79.1 ± 5.67; Day 5A: 86.6 ± 5.06; Day 5B: 75.5 ± 4.42; Day 9A: 88.8 ± 3.30; Day 9B: 70.7 ± 6.16; Two-way ANOVA for Th-CreLC-DG::ArchT vs ArchT(−), A vs B: Day 1: Group: F(1, 13) = 0.025, p = 0.878; Context: F(1,13) = 0.014, p = 0.907; Group × Context: F(1,13) = 0.256, p = 0.621; Day 5: Group: F(1, 13) = 2.464, p = 0.141; Context: F(1,13) = 4.804, p = 0.047; Group × Context: F(1,13) = 1.435, p = 0.252; Day 9: Group: F(1,13) = 0.027, p = 0.871; Context: F(1,13) = 17.03, p = 0.001; Group × Context: F(1,13) = 5.39, p = 0.037). Both groups received optogenetic light during trial, shaded bar denotes successful stimulation of opsin. All data are mean ± SEM. ***p < 0.005.

