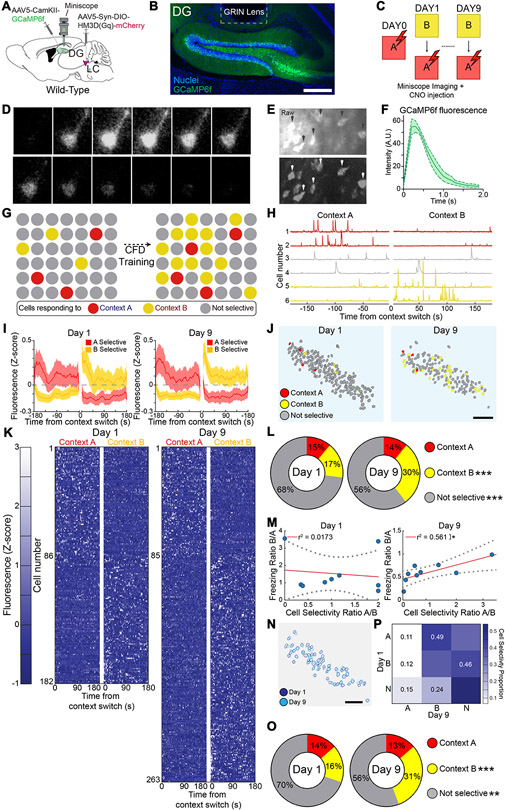
Fig. 2. Imaging of DG neural ensemble activity during contextual fear discrimination.
(A) Schematic of experimental approach depicts Ca2+ indicator (GCaMP6f) injected into the DG, and a microendoscopic GRIN lens implanted above the DG (B) Representative image depicting expression of GCaMP6f in the DG driven by CaMKII promoter and location of GRIN lens implant. Scale bar = 100 μm. (C) CFD with CNO injection 30 minutes prior to task and imaging during task. (D) Time-lapse image sequence of GCaMP6f fluorescence in an individual neuron. (E) Example of raw and dF/F in vivo epifluorescence images. (F) Intensity measurement of fluorescence dynamics from GCaMP6f+ neurons (n = 6). (G) Schematic depicts hypothetical ensemble changes in the DG during CFD training. (H) Representative neurons responding selectively to context A (unsafe, top), context B (safe, bottom), or responding nonselectively (middle). (I) Averaged cell activity traces during days 1 and 9 of CFD task for neurons responding selectively to context A or context B. (J) Representative map of changes in context selectivity from day 1 (left) to 9 (right) of training in wild-type mice. (K) Fluorescence maps of cells identified from wild-type mice as responding selectively to context A (unsafe) and context B (safe) during days 1 (left) and 9 (right) of training (n = 9). There was a minimum 3-hour gap between exposure to context B and context A. Cells were classified using a two-tailed t-test comparing Z-normalized fluorescence during the first 180 seconds in each context during Days 1 and 9. (L) Distribution of cells responding selectively to A, selectively to B, or nonselectively between days 1 and 9 of training (Chi-squared for selectivity: Context A: Chi-square = 0.168, Bonferonni adj. p-value (p < 0.008) = 0.682; Context B: Chi-square = 27.3, Bonferonni adj. p-value (p < 0.008) < 0.001; Nonselective: Chi-square = 18.1575, Bonferonni adj. p-value (p < 0.008) < 0.001). (M) Linear regression using Pearson correlation for ratio of cell selectivity between context A and context B vs. ratio of freezing behavior between context A and context B (Pearson correlation for cell selectivity ratio vs. freezing ratio: Day 1: r = −0.132, r2 = 0.0173, p = 0.737; Day 9: r = 0.749, r2 = 0.561, p = 0.0202). (N) Schematic depicting matching of reliably tracked neurons recorded both at the beginning and end of training. (O) Representation of shifts in cell selectivity between Day 1 and Day 9 of CFD training in reliably tracked neurons. (P) Distribution of cells identified at both the beginning and end of training responding selectively to A, selectively to B, or nonselectively between days 1 and 9 of training (Chi-squared for selectivity: Context A: Chi-square = 0, Bonferonni adj. p-value (p < 0.008) = 1; Context B: Chi-square = 13.9, Bonferonni adj. p-value (p < 0.008) < 0.001; Nonselective: Chi-square = 7.54, Bonferonni adj. p-value (p < 0.008) = 0.006. All data are mean ± SEM. *p < 0.05, **p < 0.01, ***p < 0.005.

