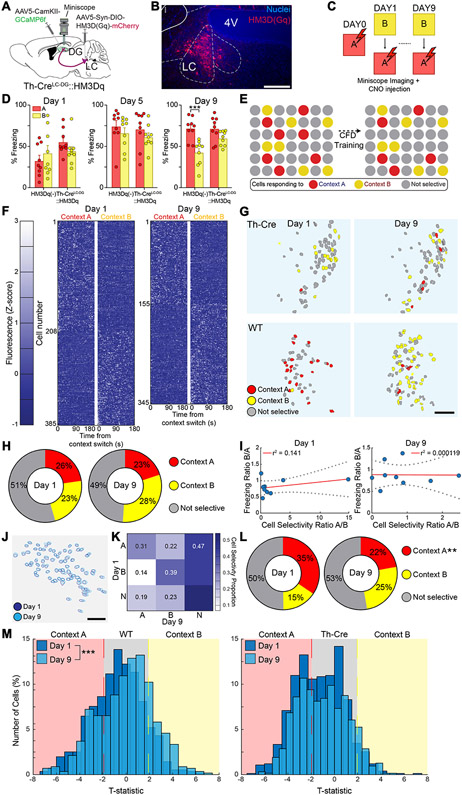
Fig. 3. Chemogenetic activation of LC-NE neurons alters DG neural ensemble activity during contextual fear discrimination.
(A) Schematic of experimental approach depicts infection of LC-NE cells using Th-Cre mouse line with DREADD system activating HM3Dq signaling chemogenetically (Th-CreLC-DG::HM3Dq), as well as Ca2+ indicator (GCaMP6f) injected into the DG, and microendoscopic GRIN lens implanted above the DG. (B) Representative image depicting expression of HM3Dq in LC-NE cells of Th-Cre mice. Scale bar = 50 μm (C) CFD task with CNO injection 30 minutes prior to task and imaging during task. (D) Chemogenetic activation of the LC-NE system impairs behavioral pattern separation in mice expressing HM3Dq in LC-DG projections (Th-CreLC-DG::HM3Dq, n = 9), but not in wild-type controls (HM3Dq(−), n = 9). HM3Dq(−) controls were able to discriminate on the ninth day of training, while Th-CreLC-DG::HM3Dq mice were unable to discriminate during the training (HM3Dq(−): Day 1A: 32.2 ± 6.40; Day 1B: 41.7 ± 9.34; Day 5A: 74.4 ± 6.99; Day 5B: 66.2 ± 6.37; Day 9A: 71.8 ± 4.52; Day 9B: 42.3 ± 5.03;Th-CreLC-DG::HM3Dq: Day 1A: 55.3 ± 4.97; Day 1B: 44.3 ± 5.61; Day 5A: 71.4 ± 7.55; Day 5B: 61.7 ± 4.81; Day 9A: 71.6 ± 4.97; Day 9B: 59.9 ± 2.94; Two-way ANOVA for Th-CreLC-DG::HM3Dq vs HM3Dq(−), A vs B: Day 1: Group: F(1,16) = 2.15, p = 0.162; Context: F(1,16) = 0.0566, p = 0.815; Group × Context: F(1,16) = 5.20, p = 0.0366; Day 5: Group: F(1,16) = 0.207, p = 0.655; Context: F(1,16) = 5.06, p = 0.0389; Group × Context: F(1,16) = 0.0392, p = 0.846; Day 9: Group: F(1,16) = 3.46, p = 0.0811; Context: F(1,16) = 23.82, p = 0.0002; Group × Context: F(1,16) = 4.497, p = 0.0499). (E) Schematic depicts hypothetical ensemble changes in the DG during CFD training following activation of LC-NE system. (F) Fluorescence maps of neurons identified from Th-Cre mice as responding selectively to context A (unsafe) and context B (safe) during days 1 (left) and 9 (right) of training (n = 9). There was a minimum 3-hour gap between exposure to context B and context A. Cells were classified using a two-tailed t-test comparing Z-normalized fluorescence during the first 180 seconds in each context during Days 1 and 9. (G) Representative map of changes in context selectivity from day 1 (left) to 9 (right) of training in Th-Cre mice following activation of LC-NE system (top) and in wild-type mice (bottom). (H) Distribution of cells responding selectively to context A, selectively to context B, or nonselectively during days 1 and 9 of training (Chi-squared for selectivity: Context A: Chi-square = 2.35, Bonferonni adj. p-value (p < 0.008) = 0.125; Context B: Chi-square = 6.16, Bonferonni adj. p-value (p < 0.008) = 0.0131; Nonselective: Chi-square = 0.683, Bonferonni adj. p-value (p < 0.008) = 0.006). (I) Linear regression using Pearson correlation for ratio of cell selectivity between context A and context B vs. ratio of freezing behavior between context A and context B (Pearson correlation for cell selectivity ratio vs. freezing ratio: Day 1: r = 0.375, r2 = 0.141, p = 0.32; Day 9: r = −0.109, r2 = 0.0001, p = 0.98). (K) Representation of shifts in cell selectivity between Day 1 and Day 9 of CFD training in reliably tracked neurons. (L) Distribution of cells identified at both the beginning and end of training responding selectively to A, selectively to B, or nonselectively between days 1 and 9 of training (Chi-squared for selectivity: Context A: Chi-square = 8.82, Bonferonni adj. p-value (p < 0.008) = 0.003; Context B: Chi-square = 6.98, Bonferonni adj. p-value (p < 0.008) = 0.0082; Nonselective: Chi-square = 0.307, Bonferonni adj. p-value (p < 0.008) = 0.580). (M) Normalized distribution of all identified neurons in wild-type controls (left) and Th-CreLC-DG::HM3Dq mice (right) during days 1 and 9 of training (Kolmogorov-Smirnov test between Days 1 and 9: HM3Dq(−): K-stat = 0.171, p < 0.001; Th-CreLC-DG::HM3Dq: K-stat = 0.0724, p = 0.0533). All data are mean ± SEM. *p < 0.05, **p < 0.01, ***p < 0.005.

