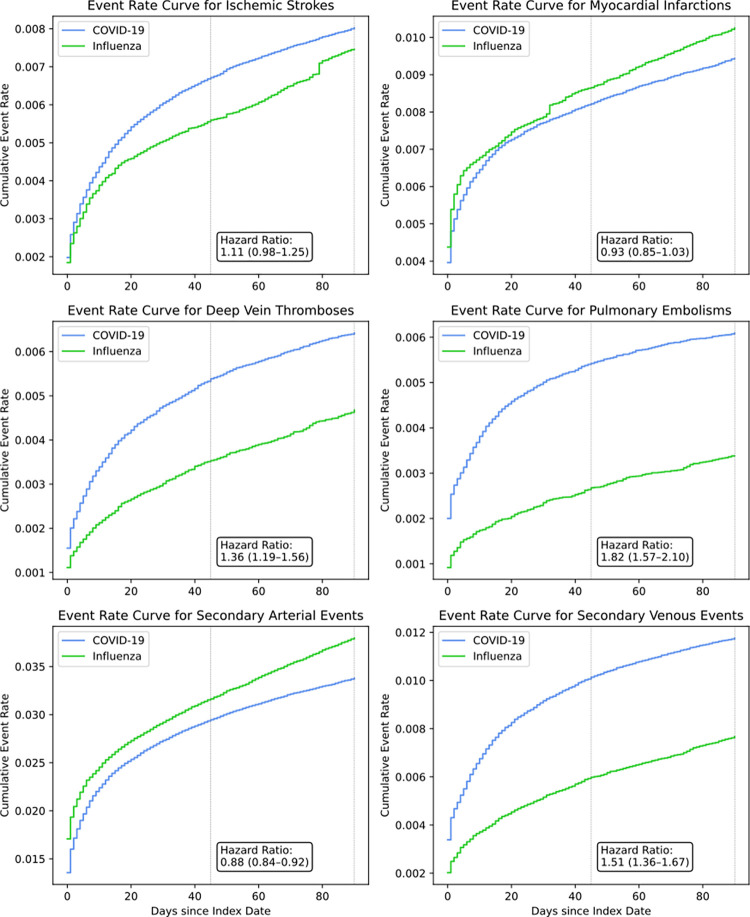
Fig 3. Propensity-weighted cumulative event rate curves for secondary outcomes.
Hazard ratios with 95% confidence intervals are shown. After weighting, cohorts were balanced across 49 covariates including demographics, medication use, and clinical comorbidities associated with arterial and venous thromboembolism.

