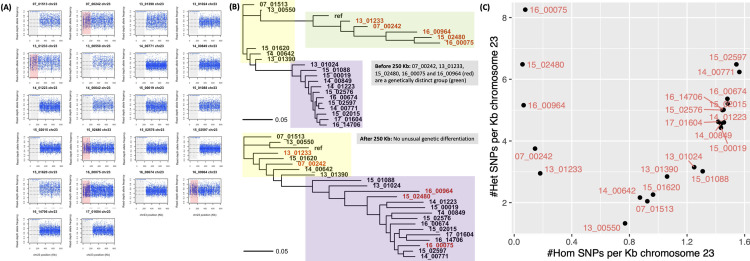
Fig 6.
RDAF distributions (A) and phylogenies (B) constructed from SNPs at chromosome 23 at 0–250 Kb (grey and red in RDAF plots, top phylogeny) and >250 Kb (uncoloured RDAF, bottom phylogeny) showing the relatedness of the 22 isolates with the L. tropica reference genome (“ref”). This showed unique ancestries at chromosome 23 at 0–250 Kb with patterns related to the L. tropica reference in 07_00242, 13_01233, 15_02480, 16_00075 and 16_00964 (red in RDAF plots, red in phylogenies) and different patterns in the other 17 isolates. The inferred genetically distinct groups are represented by the L. tropica reference (yellow area) and non-reference groups (purple area). (C) The homozygous (x-axis) and heterozygous (y-axis) SNPs per Kb for all 22 samples.

