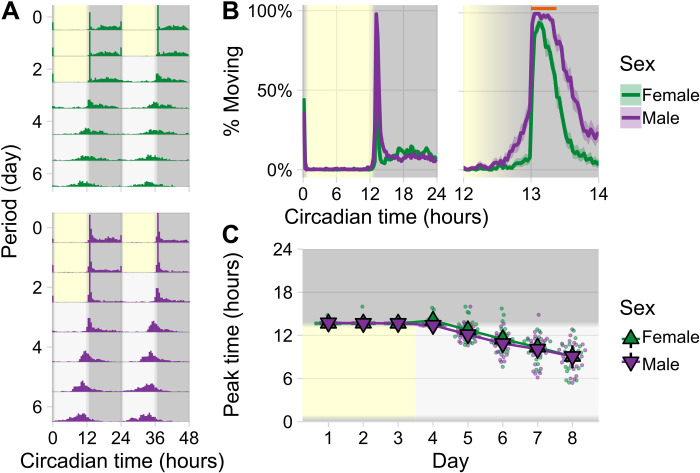
Fig. 1. Circadian locomotor analysis of mosquitoes held in activity monitors (TriKinetics) housed in single-sex groups of three in glass activity tubes.
(A) Double-plotted actograms for entire experiment: three days of 12-hour light/12-hour dark entrainment (with 1 hour dusk/dawn simulations) indicated by the yellow (day) and dark gray (night) background at 28°C followed by 5 days of free-running conditions, where the light gray background indicates the previously entrained day phase of the experiment and the dark gray background indicates the previously entrained night phase, i.e., constant darkness and constant temperature. Activity data are binned at 30 min and plotted in overlapping 48-hour intervals to visualize periodicity. (B) Average locomotor activity across three entrainment days (left: for entire 24 hours; right: for 2 hours around dusk). Activity is plotted as percentage of groups moving ±SEM. Orange bar indicates period of high activity. (C) Daily peak activity times across the entire experiment, calculated as time of highest activity from low-pass–filtered raw data (>30 min). Triangles display group means ± 95% confidence interval (CI) (n = 20 female tubes and 27 male tubes). Data are shown from one experiment.

