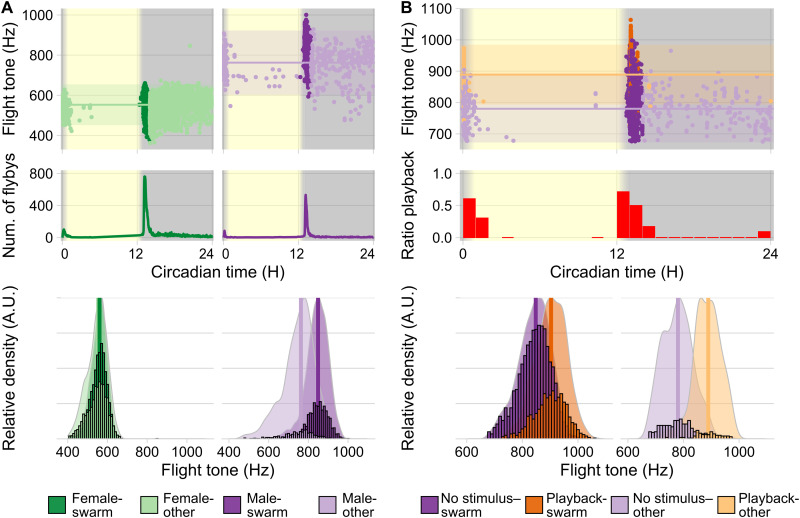
Fig. 2. Acousto-circadian analysis of free-flying Anopheles (~100 single-sex individuals in 30 cm–by–30 cm–by–30 cm “bug dorms”).
(A) Top: Female (green) and male (purple) flight tones during 12-hour light/12-hour dark entrainment (1-hour dusk/dawn) at 28°C. Points represent median flight tone frequencies of individual flybys; darker colors mark swarm time. Horizontal lines show population means for out-of-swarm (other) flight tones ±95% CI (female = 547 Hz, σ = 51 Hz, n = 2339 flight tones; male = 751 Hz, σ = 80 Hz, n = 445 flight tones). Middle: Running averages (5-min window) of flyby events as activity measure. Mean peak activity times across all days: female = 13.18 H, σ = 0.01 H, n = 12 days; male = 13.15 H, σ = 0.01 H, n = 18 days. Bottom: Bar plots of individual (male/female) flight tones plotted against scaled density plots show distribution shifts between the phases: swarm and out-of-swarm (other). Vertical lines show respective means (female-swarm = 556 Hz, σ = 40 Hz, n = 3040 flight tones; female-other = 547 Hz, σ = 51 Hz, n = 2339 flight tones; male-swarm = 844 Hz, σ = 55 Hz, n = 1600 flight tones; male-other = 751 Hz, σ = 80 Hz, n = 445 flight tones). (B) Top: Flight tones of males presented with a 1-min artificial female flight tone (550 Hz) at 30-min intervals. Middle: Flyby events during playback as a proportion of total number of flybys within each interval. Bottom: Bar plots of individual flight tones plotted against scaled density plots show distribution shift between playback and no-playback groups for each phase. Vertical lines show respective means (no stimulus–swarm = 843 Hz, σ = 58 Hz, n = 2318 flight tones; playback-swarm = 900 Hz, σ = 58 Hz, n = 928 flight tones; no stimulus–other = 779 Hz, σ = 54 Hz, n = 354 flight tones; playback-other = 886 Hz, σ = 48 Hz, n = 92 flight tones). Data pooled across independent experiments (females = 3; males = 4; playback = 4). A.U., arbitrary units.

