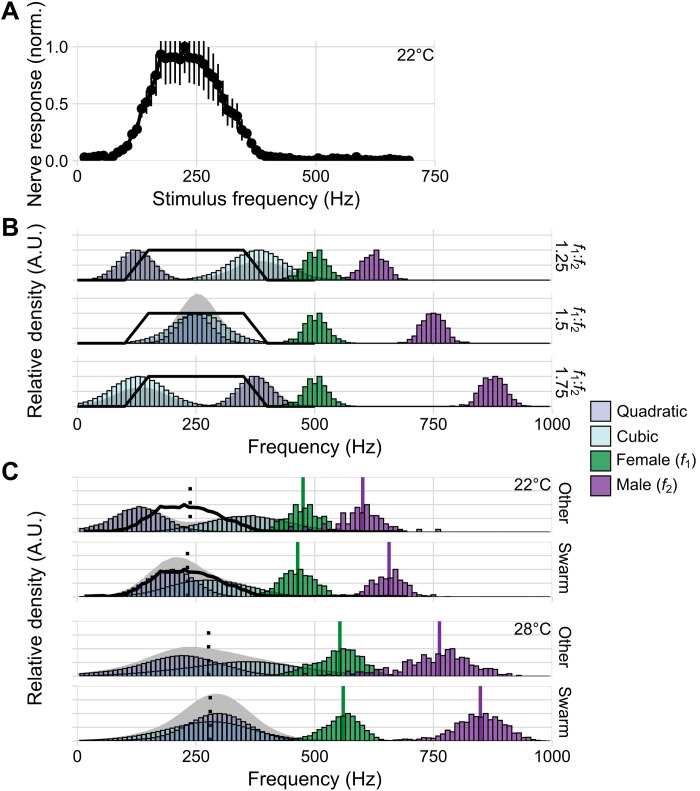
Fig. 3. Flight tone–dependent generation of audible distortion in male A. gambiae.
(A) Responses to pure tones (15 to 695 Hz, 10-Hz resolution) from antennal nerves of males (medians ± SEM; n = 7; temperature, 22°C). (B) Conceptual plot illustrating distortions (quadratic, f2 − f1; cubic, 2*f1 − f2) produced by mixing the flight tones of one hypothetical female (f1; μ = 500 Hz, σ = 25 Hz, n = 500) with three alternative males (f2; μ = 625; 750; 875 Hz, σ = 25 Hz, n = 500). Solid black lines show hypothetical nerve sensitivity range. At f2/f1 ratios of 1.5 quadratic and cubic distortion tones superimpose at a frequency of 0.5*f1; note the audibility effects of the superposition. (C) Distortions calculated from our experimental data for swarm and out-of-swarm (other) distributions. For 22°C, our nerve data (solid black line) can be compared to the created distortions (dotted line: predicted optimal frequency of 0.5*f1). At both 22° and 28°C, the overlap between the two distortion tones is greater at swarm time. Colored vertical lines show corresponding mean flight tones (22°C-other: females = 475 Hz, σ = 37 Hz, n = 447 flight tones; males = 595 Hz, σ = 52 Hz, n = 83 flight tones; 22°C-swarm: females = 464 Hz, σ = 37 Hz, n = 1137 flight tones; males = 653 Hz, σ = 39 Hz, n = 454 flight tones; 28°C-other: females = 547 Hz, σ = 51 Hz, n = 2339 flight tones; male-other = 751 Hz, σ = 80 Hz, n = 445 flight tones; females = 556 Hz, σ = 40 Hz, n = 3040 flight tones; males = 844 Hz, σ = 55 Hz, n = 1600 flight tones). Average male/female flight tone ratios were calculated for each condition (22°C-other = 1.26, σ = 0.15, n = 37,101 pairs; 22°C-swarm = 1.41, σ = 0.14, n = 516,198 pairs; 28°C-other = 1.38 σ = 0.20, n = 1,040,855 pairs; 28°C-swarm = 1.53, σ = 0.16, n = 4,864,000 pairs). The 22°C data were pooled across two independent experiments.

