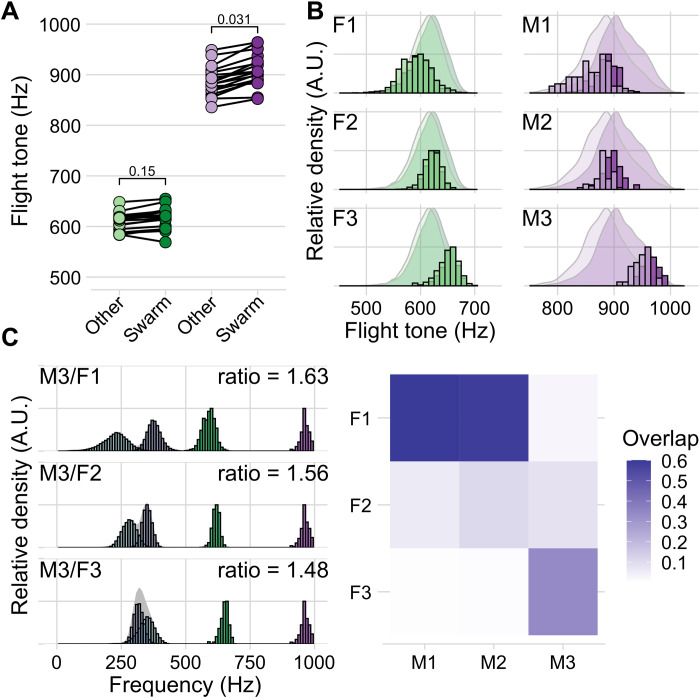
Fig. 5. Single mosquito phonotype analysis of individually housed mosquitoes in a custom-made 5 cm–by–5 cm–by–5 cm mini flight arena.
(A) Swarm and out-of-swarm (other) flight tones of individual female (green) and male (purple) mosquitoes recorded during 12-hour light/12-hour dark entrainment (with 1-hour simulated dusk and dawn) at 28°C. Points are mean flight tones calculated from all detected flight tones in the designated time window for each individual (female-other = 607 Hz, σ = 17 Hz; female-swarm = 616 Hz, σ = 21 Hz n = 18 females; male-other = 883 Hz, σ = 29 Hz; male-swarm = 907 Hz, σ = 32 Hz n = 18 males). (B) Flight tone distributions of three representative female (F1 to F3) and three representative male (M1 to M3) phonotypes. Bar plots are scaled, binned counts of the individuals flight tones recorded during swarm time (darker color) and out-of-swarm time (lighter color). These are plotted against the population scaled density plots for comparison. (C) Distribution of distortion products (cubic, light blue; quadratic, dark blue) that would be produced between M3 (purple) and the three representative females (F1 to F3, green). Average ratio value is calculated for every combination of male and female flight tone for each pair (M3/F1 = 1.63, σ = 0.07, n = 65,160 pairs; M3/F2 = 1.56, σ = 0.04, n = 33,240 pairs; M3/F3 = 1.48, σ = 0.04, n = 41,280 pairs). Heatmap displays the proportion of overlap between the two calculated distortion tone distributions for each representative female/male pair. Both female and male data are pooled from three independent experiments each with six individuals.

