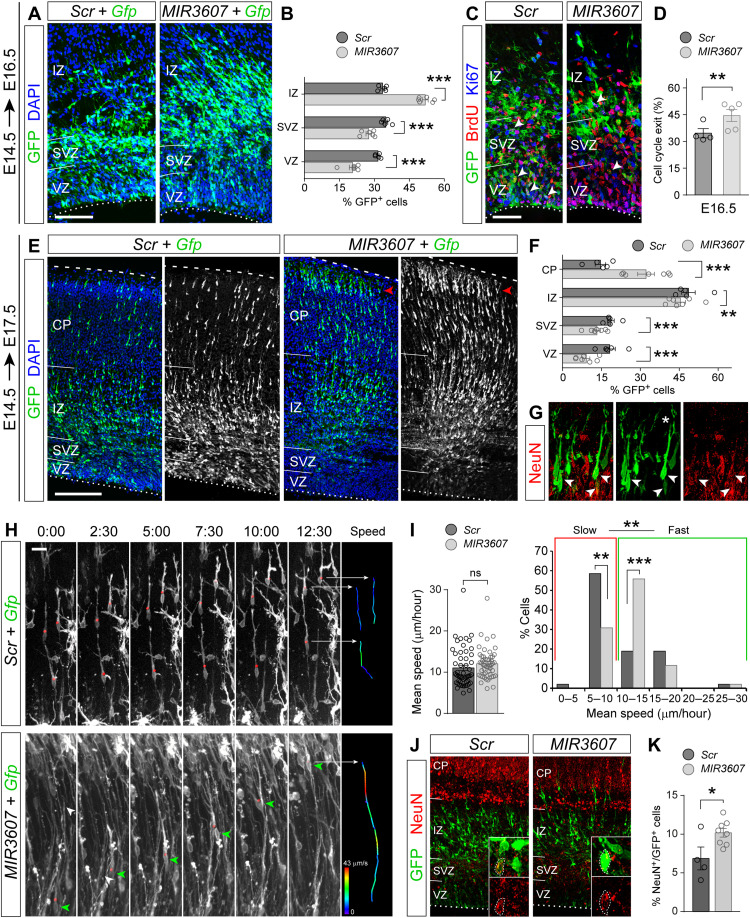
Fig. 3. Alterations in neurogenesis and neuron migration upon expression of MIR3607.
(A to D) Parietal cortex of E16.5 mouse embryos electroporated at E14.5 with the indicated plasmids (A and C), followed by a single pulse of BrdU at E15.5 (C), and quantification of laminar distribution of GFP+ cells (B) and cell cycle exit (D). N = 4 embryos Scr; N = 5 embryos MIR3607. (E to G) Distribution of GFP+ cells in E17.5 embryos electroporated at E14.5 with the indicated plasmids (E), quantification (F), and coexpression of NeuN in CP (G) (arrowheads; the asterisk indicates immature apical dendrite). (H and I) Selected videomicroscopy frames showing neurons migrating through IZ (H) and quantification of mean migration speed (I). Time elapsed since first frame is indicated in hour:min. Instant speed of indicated cells (red dots, green arrowheads) during the period shown is color-coded in (H). N = 53 cells Scr; N = 52 cells MIR3607. (J and K) NeuN expression in E16.5 embryos electroporated at E14.5 (J) and frequency of GFP+ cell labeling (K). Insets are high magnifications illustrating GFP+ cells positive for NeuN (dotted circles). N = 4 embryos Scr; N = 8 embryos MIR3607. Circles in plots indicate values for individual embryos. Mean ± SEM; chi-square test (B, D, F, I, and K), t test (I); ns, not significant; *P < 0.05, **P < 0.01, and ***P < 0.001. Scale bars, 100 μm (A, C, and J), 200 μm (E), and 10 μm (H).

